Two random samples were drawn from members of the U.S. Congress. One sample was taken from members who are Democrats and the other from members who are Republicans. For each sample, the number of dollars spent on federal projects in each congressperson's home district was recorded.
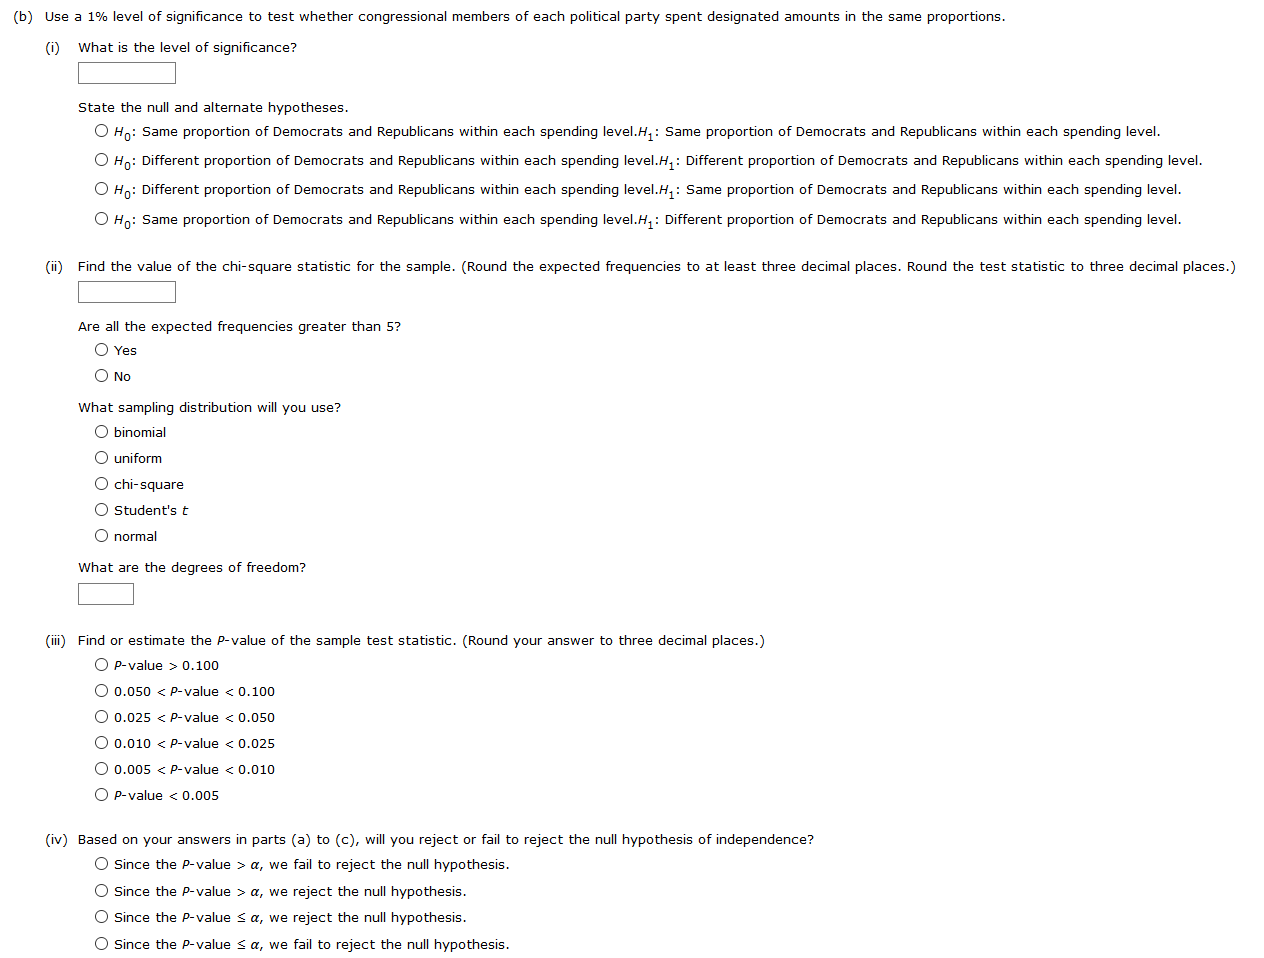
congressperson's home district was recorded. Two random samples were drawn from members of the U.S. Congress. One sample was taken from members who are Democrats and the other from members who are Republicans. For each sample, the number of dollars spent on federal projects in each Dollars Spent on Federal Projects in Home Districts Party Less than 5 Billion 5 to 10 Billion More than 10 billion Row Total Democratic 10 14 21 45 Republican 15 18 14 47 Column Total 25 32 35 92 (a) Make a cluster bar graph showing the percentages of Congress members from each party who spent each designated amount in their respective home districts. (In the graphs, blue represents Democrats and red represents Republicans.) 60 60 60 60 a 50 b 50 C 50 17% d 50-47% 40 40 38 % 38 % Percentage 30 Percentage Percentage 32 % 30 31% 30 30 % Percentage 30 % 31 9 32% 30 21% 20 21 % 22 % 18% 20- 15% 18% 20- 22 % 14% 14% 20- 14% 14% 15% 10 %% 10 in 10 billion 10 billion AO 10 billion Party Spending Party Spending(b) Use a 1% level of signicance to test whether congressional members of each political party spent designated amounts in the same proportions. (i) What is the level of signicance? State the null and alternate hypotheses. 0H0: 0H0: 0H0: 0H0: Same proportion of Democrats and Republicans within each spending level.H1: Same proportion of Democrats and Republicans Within each spending level. Different proportion of Democrats and Republicans Within each spending levelJi'l: Different proportion of Democrats and Republicans Within each spending level. Different proportion of Democrats and Republicans within each spending level.Hl: Same proportion of Democrats and Republicans within each spending level. Same proportion of Democrats and Republicans within each spending level.H1: Different proportion of Democrats and Republicans within each spending level. (ii) Find the value of the chiesquare statistic for the sample. (Round the expected eouencies to at least three decimal places. Round the test statistic to three decimal places.) Are all the expected frequencies greater than 5? 0 Yes 0 No What sampling distribution Will you use? 0 binomial O uniform O chi-square O Student's t 0 normal What are the degrees of freedom? (iii) Find or estimate the P-value of the sample test statistic. (Round your answer to three deCimal places.) 0 Pvalue > 0.10:] O 0.050 a, we fail to reject the null hypothesis. 0 Since the P-value > a, we reject the null hypothesis. 0 Since the P-value S or, we reject the null hypothesis. 0 Since the P-value S a, we fail to reject the null hypothesis


