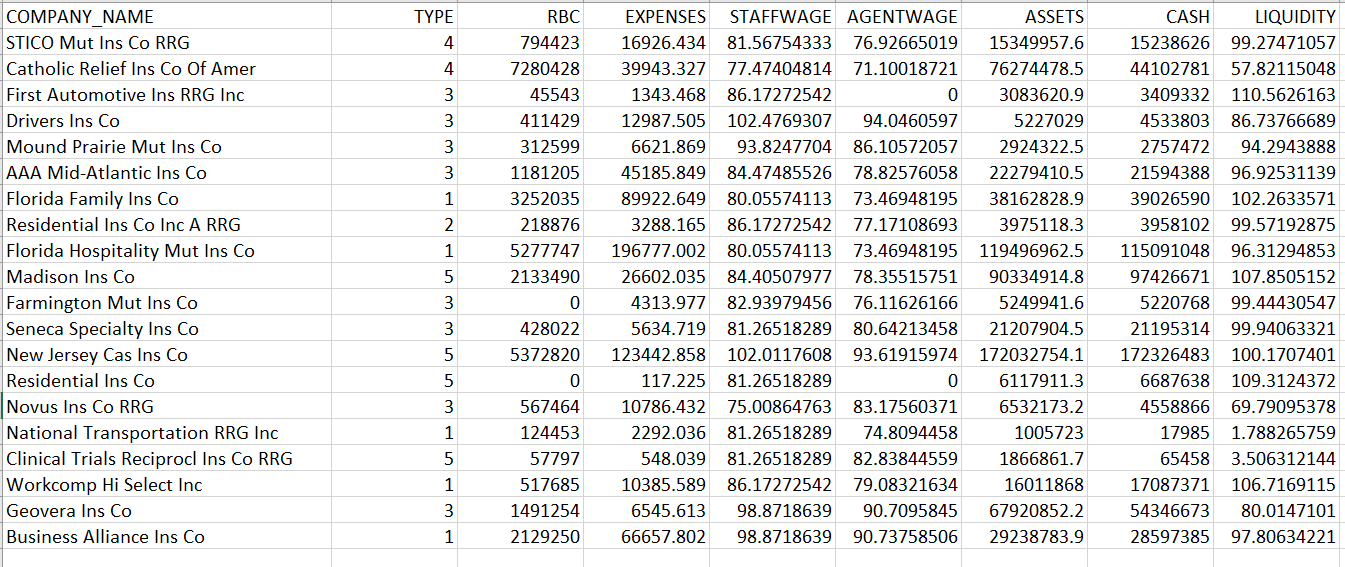
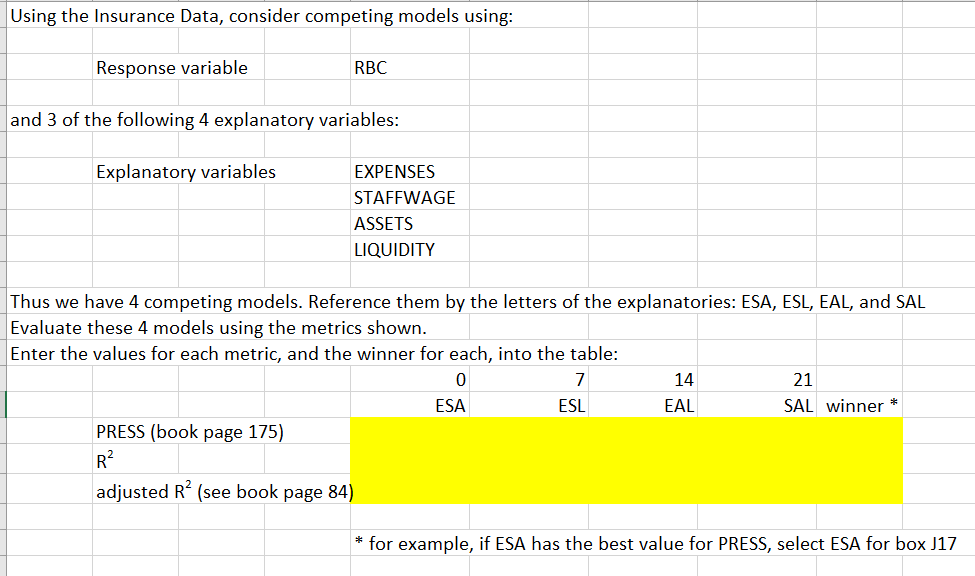
TYPE 4 4 3 3 3 3 RBC 794423 7280428 45543 411429 312599 1181205 3252035 218876 5277747 2133490 0 428022 5372820 1 2 COMPANY_NAME STICO Mut Ins Co RRG Catholic Relief Ins Co Of Amer First Automotive Ins RRG Inc Drivers Ins Co Mound Prairie Mut Ins Co AAA Mid-Atlantic Ins Co Florida Family Ins Co Residential Ins Co Inc A RRG Florida Hospitality Mut Ins Co Madison Ins Co Farmington Mut Ins Co Seneca Specialty Ins Co New Jersey Cas Ins Co Residential Ins Co Novus Ins Co RRG National Transportation RRG Inc Clinical Trials Reciprocl Ins Co RRG Workcomp Hi Select Inc Geovera Ins Co Business Alliance Ins Co 1 5 3 3 5 5 3 1 5 EXPENSES STAFFWAGE AGENTWAGE 16926.434 81.56754333 76.92665019 39943.327 77.47404814 71.10018721 1343.468 86.17272542 0 12987.505 102.4769307 94.0460597 6621.869 93.8247704 86.10572057 45185.849 84.47485526 78.82576058 89922.649 80.05574113 73.46948195 3288.165 86.17272542 77.17108693 196777.002 80.05574113 73.46948195 26602.035 84.40507977 78.35515751 4313.977 82.93979456 76.11626166 5634.719 81.26518289 80.64213458 123442.858 102.0117608 93.61915974 117.225 81.26518289 0 10786.432 75.00864763 83.17560371 2292.036 81.26518289 74.8094458 548.039 81.26518289 82.83844559 10385.589 86.17272542 79.08321634 6545.613 98.8718639 90.7095845 66657.802 98.8718639 90.73758506 ASSETS 15349957.6 76274478.5 3083620.9 5227029 2924322.5 22279410.5 38162828.9 3975118.3 119496962.5 90334914.8 5249941.6 21207904.5 172032754.1 6117911.3 6532173.2 1005723 1866861.7 16011868 67920852.2 29238783.9 CASH 15238626 44102781 3409332 4533803 2757472 21594388 39026590 3958102 115091048 97426671 5220768 21195314 172326483 6687638 4558866 17985 65458 17087371 54346673 28597385 LIQUIDITY 99.27471057 57.82115048 110.5626163 86.73766689 94.2943888 96.92531139 102.2633571 99.57192875 96.31294853 107.8505152 99.44430547 99.94063321 100.1707401 109.3124372 69.79095378 1.788265759 3.506312144 106.7169115 80.0147101 97.80634221 0 567464 124453 57797 517685 1491254 2129250 1 3 1 Using the Insurance Data, consider competing models using: Response variable RBC and 3 of the following 4 explanatory variables: Explanatory variables EXPENSES STAFFWAGE ASSETS LIQUIDITY Thus we have 4 competing models. Reference them by the letters of the explanatories: ESA, ESL, EAL, and SAL Evaluate these 4 models using the metrics shown. Enter the values for each metric, and the winner for each, into the table: 0 7 14 21 ESA ESL EAL SAL winner * PRESS (book page 175) R2 adjusted R? (see book page 84) for example, if ESA has the best value for PRESS, select ESA for box J17 TYPE 4 4 3 3 3 3 RBC 794423 7280428 45543 411429 312599 1181205 3252035 218876 5277747 2133490 0 428022 5372820 1 2 COMPANY_NAME STICO Mut Ins Co RRG Catholic Relief Ins Co Of Amer First Automotive Ins RRG Inc Drivers Ins Co Mound Prairie Mut Ins Co AAA Mid-Atlantic Ins Co Florida Family Ins Co Residential Ins Co Inc A RRG Florida Hospitality Mut Ins Co Madison Ins Co Farmington Mut Ins Co Seneca Specialty Ins Co New Jersey Cas Ins Co Residential Ins Co Novus Ins Co RRG National Transportation RRG Inc Clinical Trials Reciprocl Ins Co RRG Workcomp Hi Select Inc Geovera Ins Co Business Alliance Ins Co 1 5 3 3 5 5 3 1 5 EXPENSES STAFFWAGE AGENTWAGE 16926.434 81.56754333 76.92665019 39943.327 77.47404814 71.10018721 1343.468 86.17272542 0 12987.505 102.4769307 94.0460597 6621.869 93.8247704 86.10572057 45185.849 84.47485526 78.82576058 89922.649 80.05574113 73.46948195 3288.165 86.17272542 77.17108693 196777.002 80.05574113 73.46948195 26602.035 84.40507977 78.35515751 4313.977 82.93979456 76.11626166 5634.719 81.26518289 80.64213458 123442.858 102.0117608 93.61915974 117.225 81.26518289 0 10786.432 75.00864763 83.17560371 2292.036 81.26518289 74.8094458 548.039 81.26518289 82.83844559 10385.589 86.17272542 79.08321634 6545.613 98.8718639 90.7095845 66657.802 98.8718639 90.73758506 ASSETS 15349957.6 76274478.5 3083620.9 5227029 2924322.5 22279410.5 38162828.9 3975118.3 119496962.5 90334914.8 5249941.6 21207904.5 172032754.1 6117911.3 6532173.2 1005723 1866861.7 16011868 67920852.2 29238783.9 CASH 15238626 44102781 3409332 4533803 2757472 21594388 39026590 3958102 115091048 97426671 5220768 21195314 172326483 6687638 4558866 17985 65458 17087371 54346673 28597385 LIQUIDITY 99.27471057 57.82115048 110.5626163 86.73766689 94.2943888 96.92531139 102.2633571 99.57192875 96.31294853 107.8505152 99.44430547 99.94063321 100.1707401 109.3124372 69.79095378 1.788265759 3.506312144 106.7169115 80.0147101 97.80634221 0 567464 124453 57797 517685 1491254 2129250 1 3 1 Using the Insurance Data, consider competing models using: Response variable RBC and 3 of the following 4 explanatory variables: Explanatory variables EXPENSES STAFFWAGE ASSETS LIQUIDITY Thus we have 4 competing models. Reference them by the letters of the explanatories: ESA, ESL, EAL, and SAL Evaluate these 4 models using the metrics shown. Enter the values for each metric, and the winner for each, into the table: 0 7 14 21 ESA ESL EAL SAL winner * PRESS (book page 175) R2 adjusted R? (see book page 84) for example, if ESA has the best value for PRESS, select ESA for box J17