

 Type or paste question here
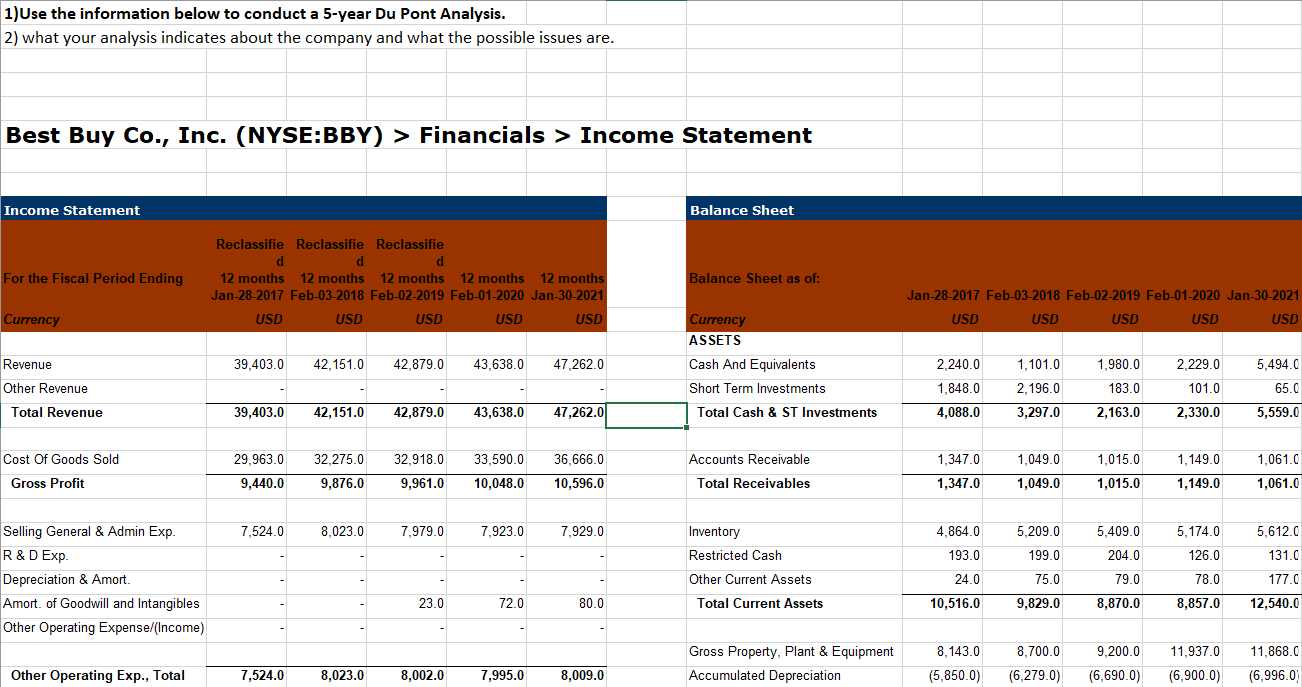
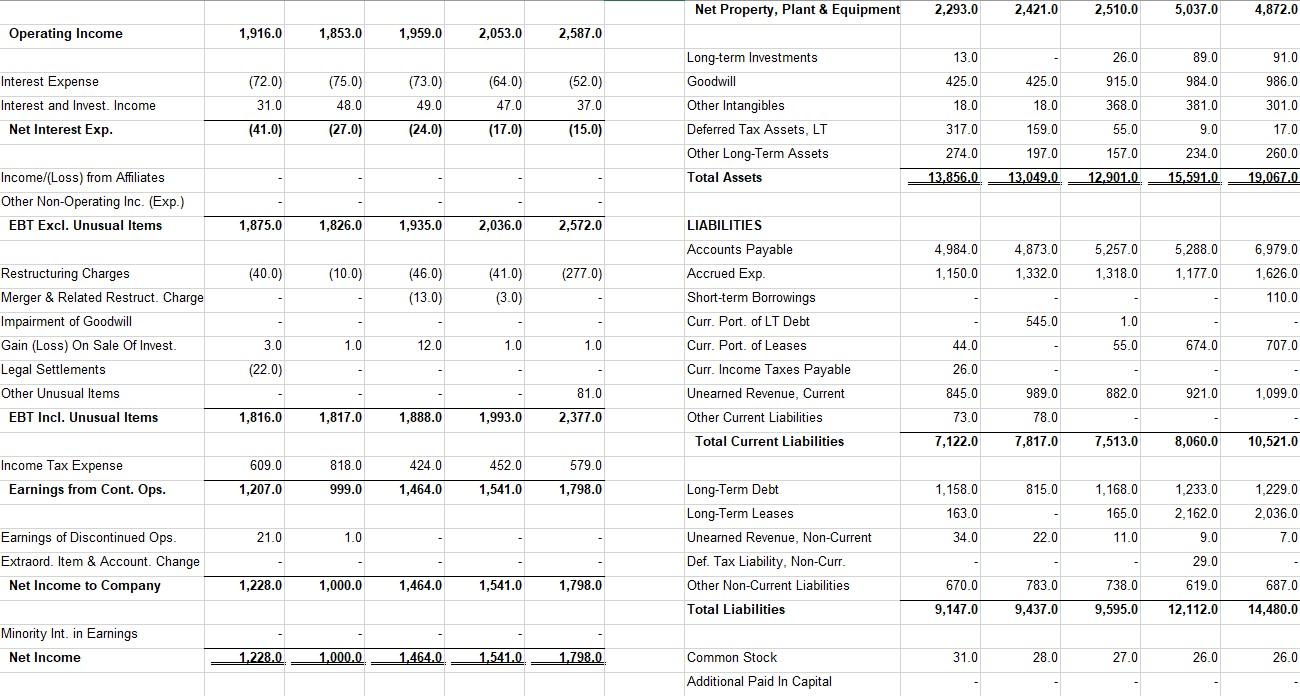
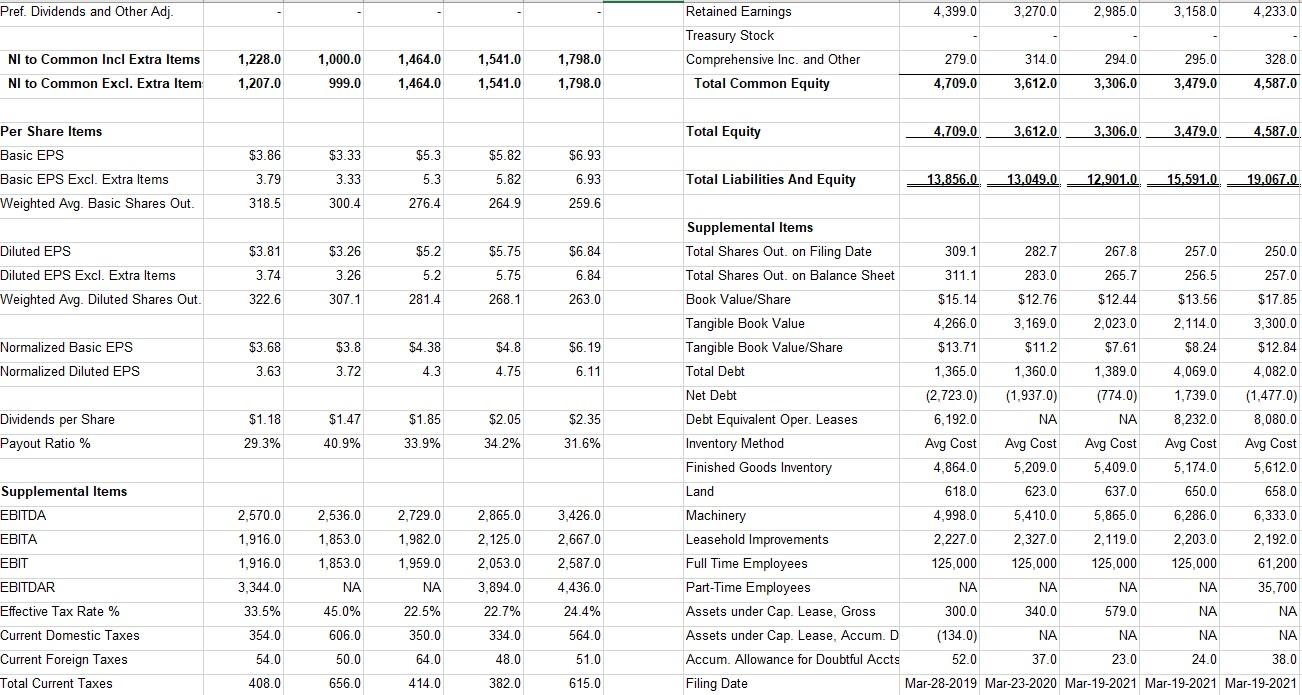
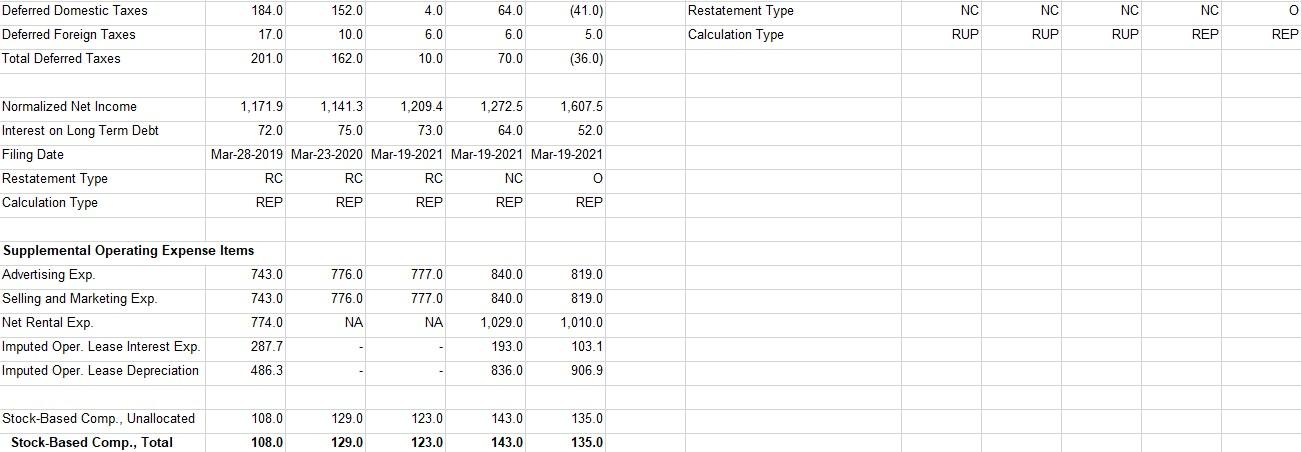
1)Use the information below to conduct a 5-year Du Pont Analysis. 2) what your analysis indicates about the company and what the possible issues are. Best Buy Co., Inc. (NYSE:BBY) > Financials > Income Statement Income Statement Balance Sheet For the Fiscal Period Ending Reclassifie Reclassifie Reclassifie d d d 12 months 12 months 12 months 12 months 12 months Jan-28-2017 Feb-03-2018 Feb-02-2019 Feb-01-2020 Jan-30-2021 USD USD USD USD USD Balance Sheet as of: Jan-28-2017 Feb-03-2018 Feb-02-2019 Feb-01-2020 Jan-30-2021 USD USD USD USD USD Currency Currency ASSETS Cash And Equivalents Short Term Investments Revenue 39,403.0 42, 151.0 42,879.0 43,638.0 47,262.0 2.240.0 1,101.0 1,980.0 2,229.0 101.0 5,494.0 65.0 1,848.0 2.196.0 183.0 Other Revenue Total Revenue 39,403.0 42,151.0 42,879.0 43,638.0 47,262.00 Total Cash & ST Investments 4,088.0 3,297.0 2,163.0 2,330.0 5,559.0 1,347.0 1,049.0 1,015.0 1,061.0 Cost Of Goods Sold Gross Profit 29,963.0 9,440.0 32,275.0 9,876.0 32,918.0 9,961.0 33,590.0 10,048.0 36,666.0 10,596.0 Accounts Receivable Total Receivables 1,149.0 1,149.0 1,347.0 1,049.0 1,015.0 1,061.0 7,524.0 8,023.0 7,979.0 7,923.0 7,929.0 5,174.0 Inventory Restricted Cash 4,864.0 193.0 5,209.0 199.0 5,409.0 204.0 5,612.0 131.0 126.0 Selling General & Admin Exp. R&D Exp Depreciation & Amort. Amort. of Goodwill and Intangibles Other Operating Expense/(Income) Other Current Assets 24.0 75.0 79.0 78.0 177.0 23.0 72.0 80.0 Total Current Assets 10,516.0 9,829.0 8,870.0 8,857.0 12,540.0 11,868.0 Gross Property, Plant & Equipment Accumulated Depreciation 8,143.0 (5,850.0) 8,700.0 (6,279.0) 9,200.0 (6,690.0) 11,937.0 (6,900.0) Other Operating Exp., Total 7,524.0 8,023.0 8,002.0 7,995.0 8,009.0 (6,996.0) Net Property, Plant & Equipment 2,293.0 2,421.0 2,510.0 5,037.0 4,872.0 Operating Income 1,916.0 1,853.0 1,959.0 2,053.0 2,587.0 13.0 26.0 91.0 Long-term Investments Goodwill 425.0 425.0 Interest Expense Interest and Invest. Income Net Interest Exp. 986.0 (72.0) 31.0 (75.0) 48,0 (73.0) 49.0 (64.0) 47.0 (17.0) (52.0) 37.0 (15.0) 89.0 984.0 381.0 915.0 368.0 18.0 18.0 301.0 (41.0) (27.0) (24.0) 159.0 55.0 9.0 17.0 Other Intangibles Deferred Tax Assets, LT Other Long-Term Assets Total Assets 317.0 274.0 13.856.0 197.0 157.0 234.0 260.0 19.067.0 13.049.0 12.901.0 15.591.0 Income/(Loss) from Affiliates Other Non-Operating Inc. (Exp.) EBT Excl. Unusual Items 1,875.0 1,826.0 1,935.0 2,036.0 2,572.0 4.873.0 4.984.0 1,150.0 5,257.0 1,318.0 5,288.0 1,177.0 (40.0) (10.0) (277.0) 1,332.0 (46.0) (13.0) (41.0) (3.0) 6,979.0 1,626.0 110.0 545.0 Restructuring Charges Merger & Related Restruct. Charge Impairment of Goodwill Gain (Loss) On Sale Of Invest. Legal Settlements Other Unusual Items EBT Incl. Unusual Items LIABILITIES Accounts Payable Accrued Exp. Short-term Borrowings Curr. Port of LT Debt Curr. Port. of Leases Curr. Income Taxes Payable Unearned Revenue, Current Other Current Liabilities Total Current Liabilities 1.0 55.0 3.0 1.0 12.0 1.0 1.0 674.0 707.0 44.0 26.0 (22.0) 81.0 845.0 989.0 8820 921.0 1,099.0 1,816.0 1,817.0 1,888.0 1,993.0 2,377.0 73.0 78.0 7,122.0 7,817.0 7,513.0 8,060.0 10,521.0 609.0 818.0 424.0 452.0 579.0 Income Tax Expense Earnings from Cont. Ops. 1,207.0 999.0 1,464.0 1,541.0 1,798.0 1,158.0 815.0 1,168.0 1,233.0 1,229.0 163.0 165.0 2,162.0 2,036.0 21.0 1.0 34.0 22.0 11.0 9.0 7.0 Earnings of Discontinued Ops Extraord. Item & Account Change Net Income to Company Long-Term Debt Long-Term Leases Unearned Revenue, Non-Current Def. Tax Liability, Non-Curr. Other Non-Current Liabilities Total Liabilities 29.0 1,228.0 1,000.0 1,464.0 1,541.0 1,798.0 670.0 783.0 738.0 619.0 687.0 9,147.0 9,437.0 9,595.0 12,112.0 14,480.0 Minority Int. in Earnings Net Income 1.228.0 1.000.0 1.464.0 1.541.0 1.798.0 31.0 28.0 27.0 26.0 26.0 Common Stock Additional Paid In Capital Pref. Dividends and Other Adj. 4.399.0 3.270.0 2.985.0 3,158.0 4,233.0 Retained Earnings Treasury Stock Comprehensive Inc. and Other Total Common Equity NI to Common Incl Extra Items 1,228.0 1,000.0 1,464.0 1,541.0 1,798.0 279.0 314.0 294.0 295.0 328.0 NI to Common Excl. Extra Item 1,207.0 999.0 1,464.0 1,541.0 1,798.0 4,709.0 3,612.0 3,306.0 3,479.0 4,587.0 Total Equity 4.709.0 3,612.0 3,306.0 3,479.0 4.587.0 $5.3 $5.82 $6.93 Per Share Items Basic EPS Basic EPS Excl. Extra Items Weighted Avg. Basic Shares Out. $3.86 3.79 $3.33 3.33 5.82 Total Liabilities And Equity 13.856.0 13.049.0 12.901.0 15.591.0 19.067.0. 5.3 276.4 6.93 259.6 318.5 300.4 264.9 $3.81 $5.2 $5.75 $6.84 Diluted EPS Diluted EPS Excl. Extra Items Weighted Avg. Diluted Shares Out. $3.26 3.26 3.74 5.2 281.4 5.75 268.1 6.84 263.0 322.6 307.1 $3.68 $3.8 $4.38 $4.8 $6.19 Normalized Basic EPS Normalized Diluted EPS 3.63 3.72 4.3 4.75 6.11 $1.18 $1.85 Dividends per Share Payout Ratio % $1.47 40.9% $2.05 34.2% $2.35 31.6% 29.3% 33.9% Supplemental Items Total Shares Out. on Filing Date 309.1 282.7 267.8 257.0 250.0 Total Shares Out. on Balance Sheet 311.1 283.0 265.7 256.5 257.0 Book Value/Share $15.14 $12.76 $12.44 $13.56 $17.85 Tangible Book Value 4,266.0 3,169.0 2,023.0 2,114.0 3,300.0 Tangible Book Value/Share $13.71 $11.2 $7.61 $8.24 $12.84 Total Debt 1,365.0 1,360.0 1,389.0 4,069.0 4,082.0 Net Debt (2.723.0) (1.9370) (774.0) 1,739.0 (1,477.0) Debt Equivalent Oper. Leases 6,192.0 NA NA 8.232.0 8,080.0 Inventory Method Avg Cost Avg Cost Avg Cost Avg Cost Avg Cost Finished Goods Inventory 4,864.0 5,209.0 5,409.0 5,174.0 5,612.0 Land 618.0 623.0 650.0 658.0 Machinery 4,998.0 5,410.0 5,865.0 6,286.0 6,333.0 Leasehold Improvements 2.227.0 2.327.0 2.119.0 2.203.0 2.192.0 Full Time Employees 125.000 125.000 125.000 125,000 61,200 Part-Time Employees NA NA NA NA 35.700 Assets under Cap. Lease, Gross 300.0 340.0 579.0 NA NA Assets under Cap. Lease, Accum. D (134.0) NA NA NA NA Accum. Allowance for Doubtful Accts 52.0 37.0 23.0 24.0 38.0 Filing Date Mar-28-2019 Mar-23-2020 Mar-19-2021 Mar-19-2021 Mar-19-2021 637.0 2,536.0 1,853.0 2,729.0 1,982.0 2,865.0 2,125.0 2,053.0 3,426.0 2.667.0 2,570.0 1,916.0 1,916.0 3,344.0 Supplemental Items EBITDA EBITA EBIT EBITDAR Effective Tax Rate % Current Domestic Taxes Current Foreign Taxes Total Current Taxes 1,959.0 1,853.0 NA 2,587.0 4,436.0 NA 3,894.0 22.7% 33.5% 45.0% 22.5% 24.4% 354.0 606.0 350.0 334.0 564.0 54.0 50.0 64.0 48.0 51.0 615.0 408.0 656.0 414.0 382.0 Deferred Domestic Taxes 184.0 4.0 64.0 NC NC NC NC O 152.0 10.0 Restatement Type Calculation Type 17.0 6.0 6.0 (41.0) 5.0 (36.0) RUP RUP RUP REP Deferred Foreign Taxes Total Deferred Taxes REP 201.0 162.0 10.0 70.0 Normalized Net Income Interest on Long Term Debt Filing Date Restatement Type Calculation Type 1,171.9 1,141.3 1.209.4 1,272.5 1,607.5 72.0 75.0 73.0 64.0 52.0 Mar-28-2019 Mar-23-2020 Mar-19-2021 Mar-19-2021 Mar-19-2021 RC RC RC NC 0 REP REP REP REP REP 776.0 777.0 840.0 819.0 776.0 777.0 840.0 819.0 Supplemental Operating Expense Items Advertising Exp. 743.0 Selling and Marketing Exp. 743.0 Net Rental Exp. 774.0 Imputed Oper. Lease Interest Exp. 287.7 Imputed Oper. Lease Depreciation 486.3 NA NA 1,029.0 1.010.0 193.0 103.1 836.0 906.9 108.0 129.0 123.0 143.0 135.0 Stock-Based Comp., Unallocated Stock-Based Comp., Total 108.0 129.0 123.0 143.0 135.0 1)Use the information below to conduct a 5-year Du Pont Analysis. 2) what your analysis indicates about the company and what the possible issues are. Best Buy Co., Inc. (NYSE:BBY) > Financials > Income Statement Income Statement Balance Sheet For the Fiscal Period Ending Reclassifie Reclassifie Reclassifie d d d 12 months 12 months 12 months 12 months 12 months Jan-28-2017 Feb-03-2018 Feb-02-2019 Feb-01-2020 Jan-30-2021 USD USD USD USD USD Balance Sheet as of: Jan-28-2017 Feb-03-2018 Feb-02-2019 Feb-01-2020 Jan-30-2021 USD USD USD USD USD Currency Currency ASSETS Cash And Equivalents Short Term Investments Revenue 39,403.0 42, 151.0 42,879.0 43,638.0 47,262.0 2.240.0 1,101.0 1,980.0 2,229.0 101.0 5,494.0 65.0 1,848.0 2.196.0 183.0 Other Revenue Total Revenue 39,403.0 42,151.0 42,879.0 43,638.0 47,262.00 Total Cash & ST Investments 4,088.0 3,297.0 2,163.0 2,330.0 5,559.0 1,347.0 1,049.0 1,015.0 1,061.0 Cost Of Goods Sold Gross Profit 29,963.0 9,440.0 32,275.0 9,876.0 32,918.0 9,961.0 33,590.0 10,048.0 36,666.0 10,596.0 Accounts Receivable Total Receivables 1,149.0 1,149.0 1,347.0 1,049.0 1,015.0 1,061.0 7,524.0 8,023.0 7,979.0 7,923.0 7,929.0 5,174.0 Inventory Restricted Cash 4,864.0 193.0 5,209.0 199.0 5,409.0 204.0 5,612.0 131.0 126.0 Selling General & Admin Exp. R&D Exp Depreciation & Amort. Amort. of Goodwill and Intangibles Other Operating Expense/(Income) Other Current Assets 24.0 75.0 79.0 78.0 177.0 23.0 72.0 80.0 Total Current Assets 10,516.0 9,829.0 8,870.0 8,857.0 12,540.0 11,868.0 Gross Property, Plant & Equipment Accumulated Depreciation 8,143.0 (5,850.0) 8,700.0 (6,279.0) 9,200.0 (6,690.0) 11,937.0 (6,900.0) Other Operating Exp., Total 7,524.0 8,023.0 8,002.0 7,995.0 8,009.0 (6,996.0) Net Property, Plant & Equipment 2,293.0 2,421.0 2,510.0 5,037.0 4,872.0 Operating Income 1,916.0 1,853.0 1,959.0 2,053.0 2,587.0 13.0 26.0 91.0 Long-term Investments Goodwill 425.0 425.0 Interest Expense Interest and Invest. Income Net Interest Exp. 986.0 (72.0) 31.0 (75.0) 48,0 (73.0) 49.0 (64.0) 47.0 (17.0) (52.0) 37.0 (15.0) 89.0 984.0 381.0 915.0 368.0 18.0 18.0 301.0 (41.0) (27.0) (24.0) 159.0 55.0 9.0 17.0 Other Intangibles Deferred Tax Assets, LT Other Long-Term Assets Total Assets 317.0 274.0 13.856.0 197.0 157.0 234.0 260.0 19.067.0 13.049.0 12.901.0 15.591.0 Income/(Loss) from Affiliates Other Non-Operating Inc. (Exp.) EBT Excl. Unusual Items 1,875.0 1,826.0 1,935.0 2,036.0 2,572.0 4.873.0 4.984.0 1,150.0 5,257.0 1,318.0 5,288.0 1,177.0 (40.0) (10.0) (277.0) 1,332.0 (46.0) (13.0) (41.0) (3.0) 6,979.0 1,626.0 110.0 545.0 Restructuring Charges Merger & Related Restruct. Charge Impairment of Goodwill Gain (Loss) On Sale Of Invest. Legal Settlements Other Unusual Items EBT Incl. Unusual Items LIABILITIES Accounts Payable Accrued Exp. Short-term Borrowings Curr. Port of LT Debt Curr. Port. of Leases Curr. Income Taxes Payable Unearned Revenue, Current Other Current Liabilities Total Current Liabilities 1.0 55.0 3.0 1.0 12.0 1.0 1.0 674.0 707.0 44.0 26.0 (22.0) 81.0 845.0 989.0 8820 921.0 1,099.0 1,816.0 1,817.0 1,888.0 1,993.0 2,377.0 73.0 78.0 7,122.0 7,817.0 7,513.0 8,060.0 10,521.0 609.0 818.0 424.0 452.0 579.0 Income Tax Expense Earnings from Cont. Ops. 1,207.0 999.0 1,464.0 1,541.0 1,798.0 1,158.0 815.0 1,168.0 1,233.0 1,229.0 163.0 165.0 2,162.0 2,036.0 21.0 1.0 34.0 22.0 11.0 9.0 7.0 Earnings of Discontinued Ops Extraord. Item & Account Change Net Income to Company Long-Term Debt Long-Term Leases Unearned Revenue, Non-Current Def. Tax Liability, Non-Curr. Other Non-Current Liabilities Total Liabilities 29.0 1,228.0 1,000.0 1,464.0 1,541.0 1,798.0 670.0 783.0 738.0 619.0 687.0 9,147.0 9,437.0 9,595.0 12,112.0 14,480.0 Minority Int. in Earnings Net Income 1.228.0 1.000.0 1.464.0 1.541.0 1.798.0 31.0 28.0 27.0 26.0 26.0 Common Stock Additional Paid In Capital Pref. Dividends and Other Adj. 4.399.0 3.270.0 2.985.0 3,158.0 4,233.0 Retained Earnings Treasury Stock Comprehensive Inc. and Other Total Common Equity NI to Common Incl Extra Items 1,228.0 1,000.0 1,464.0 1,541.0 1,798.0 279.0 314.0 294.0 295.0 328.0 NI to Common Excl. Extra Item 1,207.0 999.0 1,464.0 1,541.0 1,798.0 4,709.0 3,612.0 3,306.0 3,479.0 4,587.0 Total Equity 4.709.0 3,612.0 3,306.0 3,479.0 4.587.0 $5.3 $5.82 $6.93 Per Share Items Basic EPS Basic EPS Excl. Extra Items Weighted Avg. Basic Shares Out. $3.86 3.79 $3.33 3.33 5.82 Total Liabilities And Equity 13.856.0 13.049.0 12.901.0 15.591.0 19.067.0. 5.3 276.4 6.93 259.6 318.5 300.4 264.9 $3.81 $5.2 $5.75 $6.84 Diluted EPS Diluted EPS Excl. Extra Items Weighted Avg. Diluted Shares Out. $3.26 3.26 3.74 5.2 281.4 5.75 268.1 6.84 263.0 322.6 307.1 $3.68 $3.8 $4.38 $4.8 $6.19 Normalized Basic EPS Normalized Diluted EPS 3.63 3.72 4.3 4.75 6.11 $1.18 $1.85 Dividends per Share Payout Ratio % $1.47 40.9% $2.05 34.2% $2.35 31.6% 29.3% 33.9% Supplemental Items Total Shares Out. on Filing Date 309.1 282.7 267.8 257.0 250.0 Total Shares Out. on Balance Sheet 311.1 283.0 265.7 256.5 257.0 Book Value/Share $15.14 $12.76 $12.44 $13.56 $17.85 Tangible Book Value 4,266.0 3,169.0 2,023.0 2,114.0 3,300.0 Tangible Book Value/Share $13.71 $11.2 $7.61 $8.24 $12.84 Total Debt 1,365.0 1,360.0 1,389.0 4,069.0 4,082.0 Net Debt (2.723.0) (1.9370) (774.0) 1,739.0 (1,477.0) Debt Equivalent Oper. Leases 6,192.0 NA NA 8.232.0 8,080.0 Inventory Method Avg Cost Avg Cost Avg Cost Avg Cost Avg Cost Finished Goods Inventory 4,864.0 5,209.0 5,409.0 5,174.0 5,612.0 Land 618.0 623.0 650.0 658.0 Machinery 4,998.0 5,410.0 5,865.0 6,286.0 6,333.0 Leasehold Improvements 2.227.0 2.327.0 2.119.0 2.203.0 2.192.0 Full Time Employees 125.000 125.000 125.000 125,000 61,200 Part-Time Employees NA NA NA NA 35.700 Assets under Cap. Lease, Gross 300.0 340.0 579.0 NA NA Assets under Cap. Lease, Accum. D (134.0) NA NA NA NA Accum. Allowance for Doubtful Accts 52.0 37.0 23.0 24.0 38.0 Filing Date Mar-28-2019 Mar-23-2020 Mar-19-2021 Mar-19-2021 Mar-19-2021 637.0 2,536.0 1,853.0 2,729.0 1,982.0 2,865.0 2,125.0 2,053.0 3,426.0 2.667.0 2,570.0 1,916.0 1,916.0 3,344.0 Supplemental Items EBITDA EBITA EBIT EBITDAR Effective Tax Rate % Current Domestic Taxes Current Foreign Taxes Total Current Taxes 1,959.0 1,853.0 NA 2,587.0 4,436.0 NA 3,894.0 22.7% 33.5% 45.0% 22.5% 24.4% 354.0 606.0 350.0 334.0 564.0 54.0 50.0 64.0 48.0 51.0 615.0 408.0 656.0 414.0 382.0 Deferred Domestic Taxes 184.0 4.0 64.0 NC NC NC NC O 152.0 10.0 Restatement Type Calculation Type 17.0 6.0 6.0 (41.0) 5.0 (36.0) RUP RUP RUP REP Deferred Foreign Taxes Total Deferred Taxes REP 201.0 162.0 10.0 70.0 Normalized Net Income Interest on Long Term Debt Filing Date Restatement Type Calculation Type 1,171.9 1,141.3 1.209.4 1,272.5 1,607.5 72.0 75.0 73.0 64.0 52.0 Mar-28-2019 Mar-23-2020 Mar-19-2021 Mar-19-2021 Mar-19-2021 RC RC RC NC 0 REP REP REP REP REP 776.0 777.0 840.0 819.0 776.0 777.0 840.0 819.0 Supplemental Operating Expense Items Advertising Exp. 743.0 Selling and Marketing Exp. 743.0 Net Rental Exp. 774.0 Imputed Oper. Lease Interest Exp. 287.7 Imputed Oper. Lease Depreciation 486.3 NA NA 1,029.0 1.010.0 193.0 103.1 836.0 906.9 108.0 129.0 123.0 143.0 135.0 Stock-Based Comp., Unallocated Stock-Based Comp., Total 108.0 129.0 123.0 143.0 135.0


 Type or paste question here


