Question
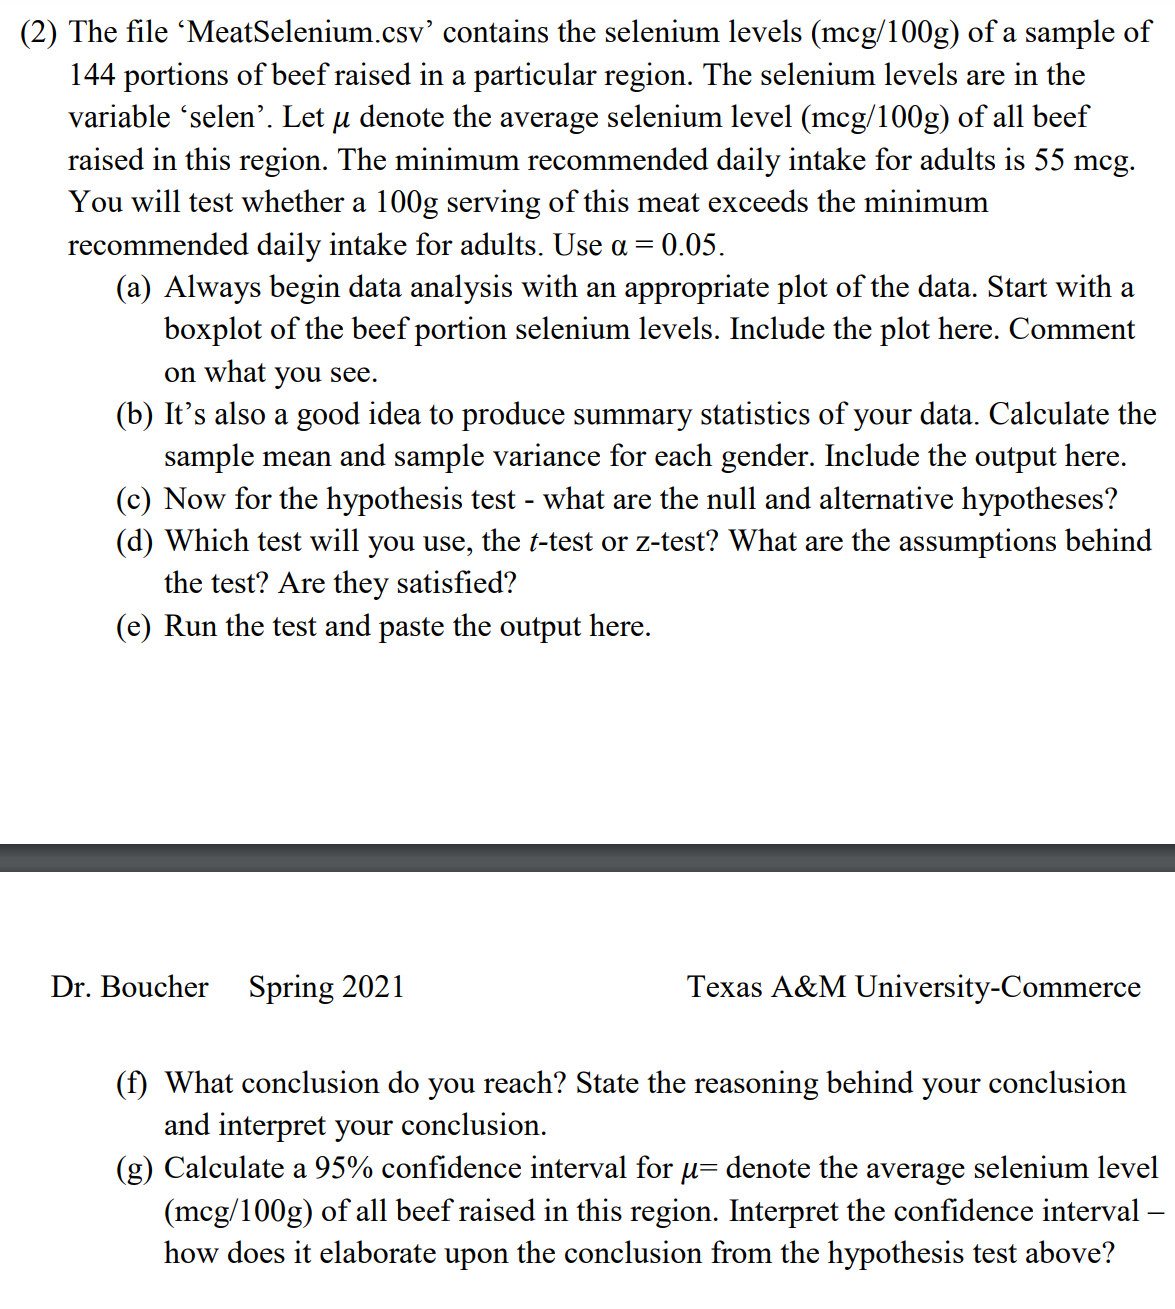
type selen NRB 44.33 NRB 76.86 NRB 4.45 NRB 55.01 NRB 58.21 NRB 74.72 NRB 11.84 NRB 139.09 NRB 69.01 NRB 94.61 NRB 48.35 NRB
type selen NRB 44.33 NRB 76.86 NRB 4.45 NRB 55.01 NRB 58.21 NRB 74.72 NRB 11.84 NRB 139.09 NRB 69.01 NRB 94.61 NRB 48.35 NRB 37.65 NRB 66.36 NRB 72.48 NRB 87.09 NRB 26.34 NRB 71.24 NRB 90.38 NRB 50.86 RRB 11.23 RRB 29.63 RRB 20.42 RRB 10.12 RRB 39.91 RRB 32.66 RRB 38.38 RRB 36.21 RRB 16.39 RRB 27.44 RRB 17.29 RRB 56.2 RRB 28.94 RRB 20.11 RRB 25.35 RRB 21.77 RRB 31.62 RRB 32.63 RRB 30.31 RRB 46.16 RRB 56.61 RRB 24.47 RRB 29.39 RRB 40.71 RRB 15.82 RRB 27.74 RRB 22.35 RRB 34.78 RRB 35.09 RRB 32.6 RRB 37.03 RRB 27 RRB 44.2 RRB 13.09 RRB 33.03 RRB 9.69 RRB 32.45 RRB 37.38 RRB 34.91 RRB 27.99 RRB 22.36 RRB 22.68 RRB 26.52 RRB 46.01 RRB 38.04 RRB 30.88 RRB 30.04 RRB 25.91 RRB 18.54 RRB 18.52 RRB 25.51 RRB 27.8 RRB 19.49 SQU 37.42 SQU 56.46 SQU 51.91 SQU 62.73 SQU 4.55 SQU 39.17 SQU 38.44 SQU 40.92 SQU 58.93 SQU 61.88 SQU 49.54 SQU 64.35 SQU 82.49 SQU 38.54 SQU 39.53 SQU 68.99 SQU 27.97 SQU 37.57 SQU 25.71 SQU 23.97 SQU 13.82 SQU 42.21 SQU 35.88 SQU 10.54 SQU 41.89 SQU 23.94 SQU 49.81 SQU 30.71 SQU 50 SQU 87.5 VEN 26.72 VEN 28.58 VEN 29.71 VEN 26.95 VEN 10.97 VEN 21.97 VEN 14.35 VEN 32.21 VEN 19.19 VEN 30.92 VEN 10.42 VEN 35.49 VEN 36.84 VEN 25.03 VEN 33.59 VEN 33.74 VEN 18.02 VEN 22.27 VEN 26.1 VEN 20.89 VEN 29.44 VEN 31.5 VEN 27.36 VEN 21.33 VEN 14.86 VEN 16.47 VEN 25.19 VEN 37.45 VEN 45.08 VEN 25.22 VEN 22.11 VEN 33.01 VEN 31.2 VEN 26.5 VEN 32.77 VEN 8.7 VEN 25.9 VEN 29.8 VEN 37.63 VEN 21.69 VEN 21.49 VEN 18.11

Step by Step Solution
There are 3 Steps involved in it
Step: 1

Get Instant Access to Expert-Tailored Solutions
See step-by-step solutions with expert insights and AI powered tools for academic success
Step: 2

Step: 3

Ace Your Homework with AI
Get the answers you need in no time with our AI-driven, step-by-step assistance
Get Started


