Answered step by step
Verified Expert Solution
Link Copied!

Question

1 Approved Answer

typewritten please Solve the following problems. 1. Study the group of tests administered to a class where Mark belongs, then answer the following questions. Subject

typewritten please
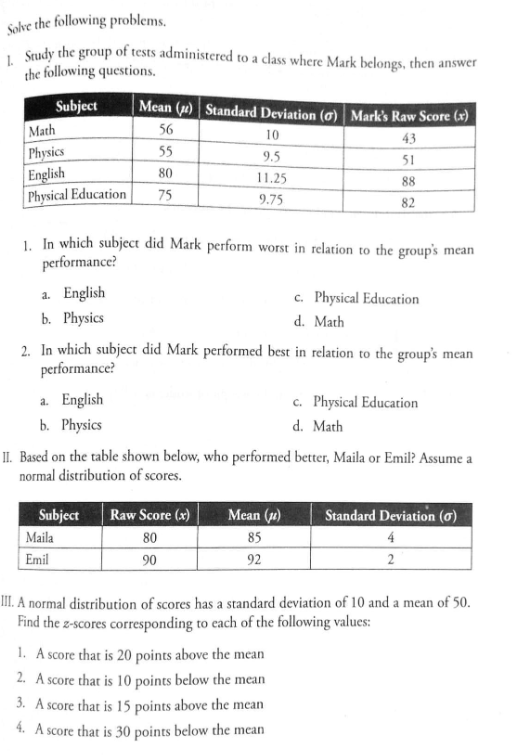
image text in transcribed
Solve the following problems. 1. Study the group of tests administered to a class where Mark belongs, then answer the following questions. Subject Mean () Standard Deviation (q) Mark's Raw Score (x) Math 56 10 43 Physics 55 9.5 51 English 80 11.25 88 Physical Education 75 9.75 82 1. In which subject did Mark perform worst in relation to the group's mean performance? a. English c. Physical Education b. Physics d. Math 2. In which subject did Mark performed best in relation to the group's mean performance? a. English c. Physical Education b. Physics d. Math II. Based on the table shown below, who performed better, Maila or Emil? Assume a normal distribution of scores. Subject Raw Score (x) Mean (1) Standard Deviation (o) Maila 80 85 Emil 90 92 III. A normal distribution of scores has a standard deviation of 10 and a mean of 50. Find the z-scores corresponding to each of the following values: 1. A score that is 20 points above the mean 2. A score that is 10 points below the mean 3. A score that is 15 points above the mean 4. A score that is 30 points below the mean

Step by Step Solution

There are 3 Steps involved in it

Step: 1

blur-text-image

Get Instant Access to Expert-Tailored Solutions

See step-by-step solutions with expert insights and AI powered tools for academic success

Step: 2

blur-text-image

Step: 3

blur-text-image

Ace Your Homework with AI

Get the answers you need in no time with our AI-driven, step-by-step assistance

Get Started

Recommended Textbook for

Calculus An Applied Approach

Authors: Ron Larson, Dennis J McKenzie, Larson/Edwards, Bruce H Edwards

7th Edition

1111809720, 9781111809720

More Books

Students also viewed these Mathematics questions