Answered step by step
Verified Expert Solution
Link Copied!

Question

1 Approved Answer

U complete) HW Score: 0%, 0 of 10 pts 10.2.16 Question Help Consider the following data from two independent samples with equal population variances. Construct
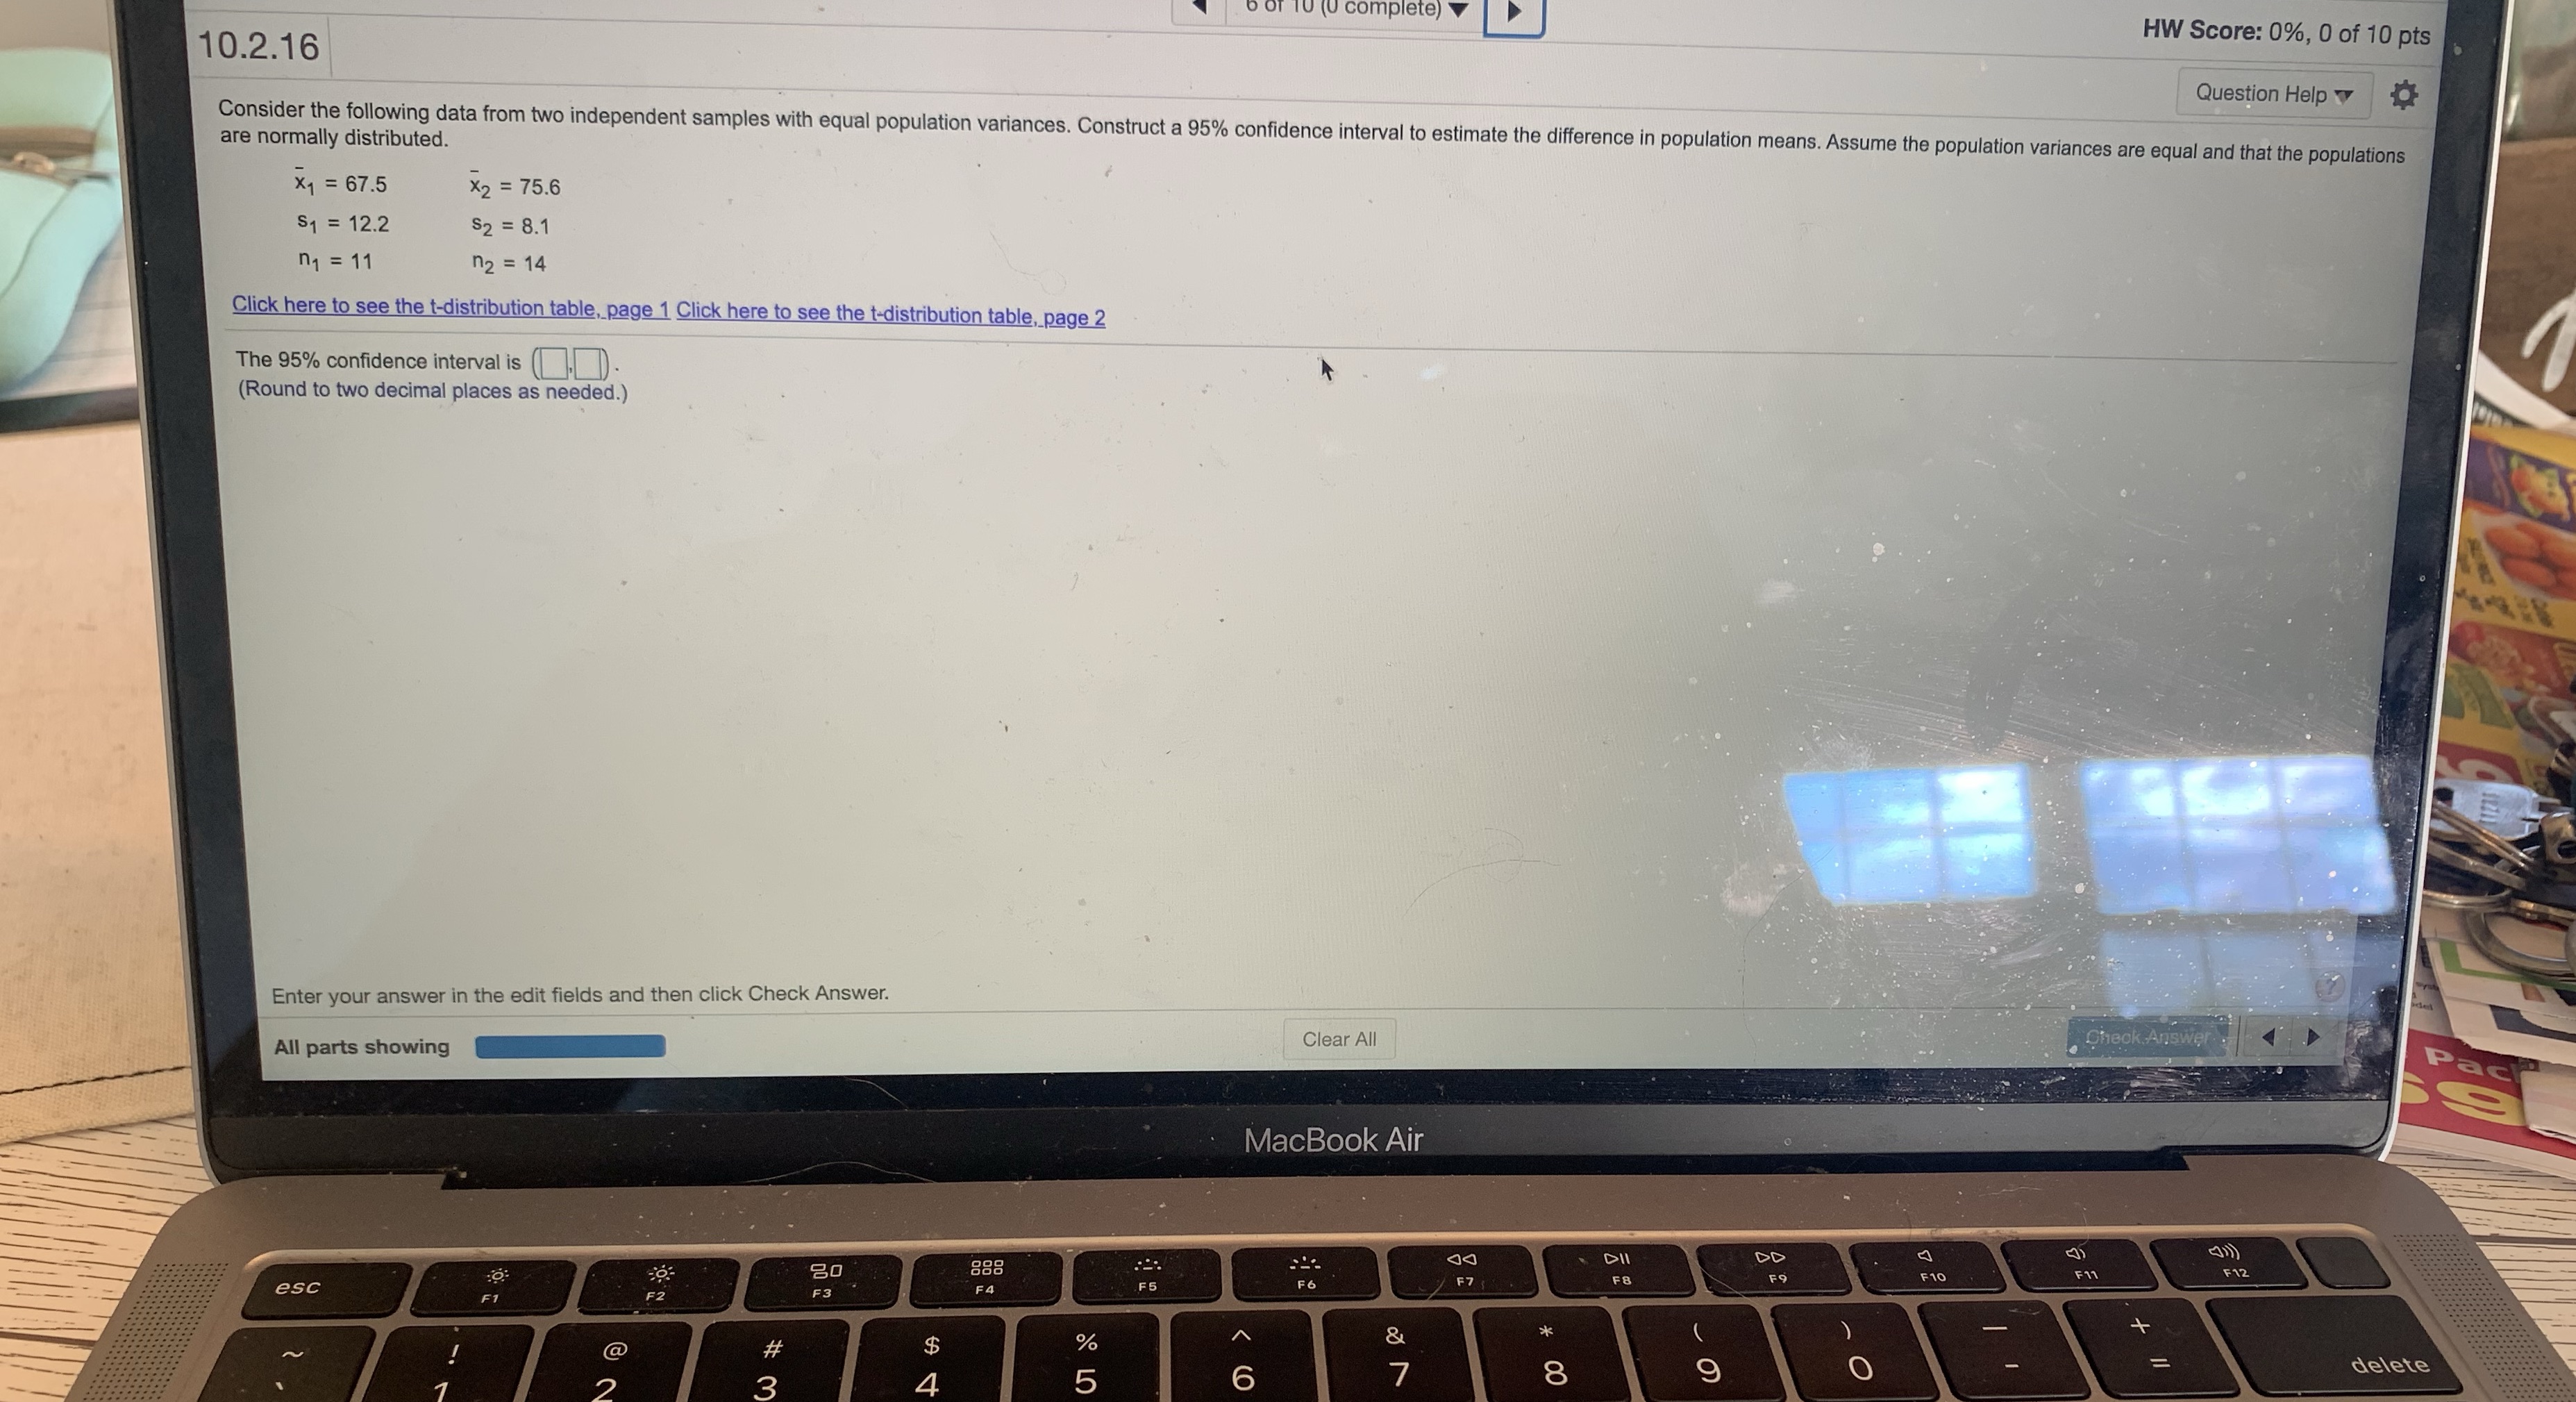
image text in transcribed
U complete) HW Score: 0%, 0 of 10 pts 10.2.16 Question Help Consider the following data from two independent samples with equal population variances. Construct a 95% confidence interval to estimate the difference in population means. Assume the population variances are equal and that the populations are normally distributed. x1 = 67.5 X2 = 75.6 $1 = 12.2 $2 = 8.1 n1 = 11 n2 = 14 Click here to see the t-distribution table, page 1 Click here to see the t-distribution table, page 2 The 95% confidence interval is (). (Round to two decimal places as needed.) Enter your answer in the edit fields and then click Check Answer. Clear All Check Answer. All parts showing Pac MacBook Air DII DD F12 20 888 F8 FO F10 F11 F5 F7 esc F2 F3 F4 delete @ O 5 6

Step by Step Solution

There are 3 Steps involved in it

Step: 1

blur-text-image

Get Instant Access to Expert-Tailored Solutions

See step-by-step solutions with expert insights and AI powered tools for academic success

Step: 2

blur-text-image

Step: 3

blur-text-image

Ace Your Homework with AI

Get the answers you need in no time with our AI-driven, step-by-step assistance

Get Started

Recommended Textbook for

Practical Linear Algebra A Geometry Toolbox

Authors: Gerald Farin, Dianne Hansford

4th Edition

1003051219, 9781003051213

More Books

Students also viewed these Mathematics questions

Question

fscanf retums a special value EOF that stands for...

Answered: 1 week ago

Question

What does the start( ) method defined by Thread do?

Answered: 1 week ago