Answered step by step
Verified Expert Solution
Question
1 Approved Answer
UCLR=D4R LCLR=D3R Use a standard deviation (z)=3. Factor for Determining from R the for X - and R-Charts 1. What is the value of the
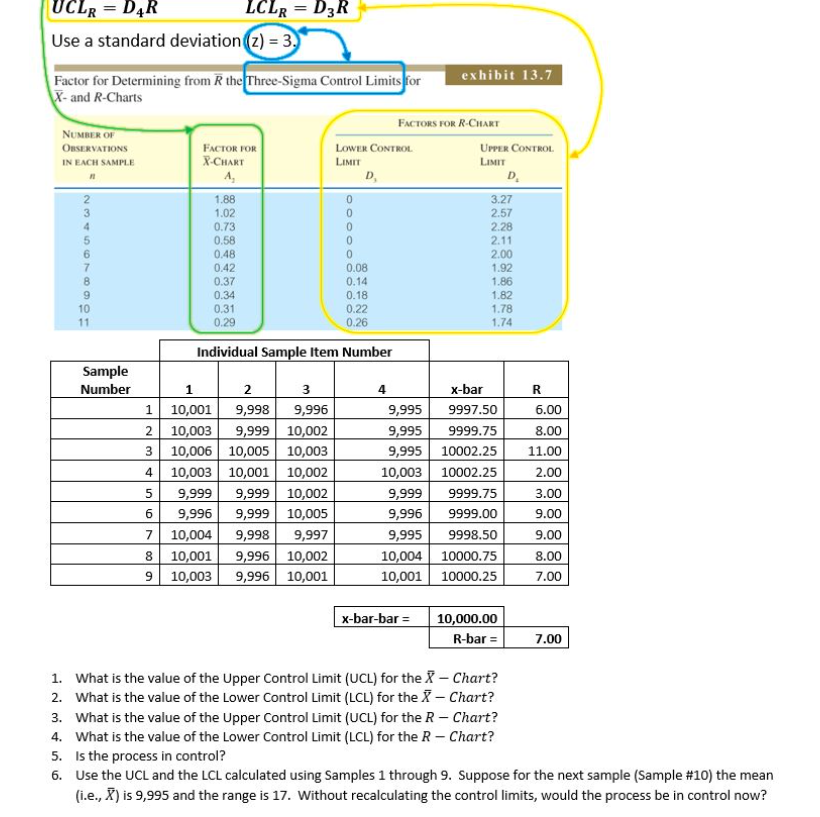 UCLR=D4R LCLR=D3R Use a standard deviation (z)=3. Factor for Determining from R the for X - and R-Charts 1. What is the value of the Upper Control Limit (UCL) for the X - Chart? 2. What is the value of the Lower Control Limit (LCL) for the X-Chart? 3. What is the value of the Upper Control Limit (UCL) for the R - Chart? 4. What is the value of the Lower Control Limit ( LCL ) for the R-Chart? 5. Is the process in control? 6. Use the UCL and the LCL calculated using Samples 1 through 9. Suppose for the next sample (Sample \#10) the mean (i.e., X ) is 9,995 and the range is 17 . Without recalculating the control limits, would the process be in control now
 Step by Step Solution
There are 3 Steps involved in it
Step: 1

Get Instant Access to Expert-Tailored Solutions
See step-by-step solutions with expert insights and AI powered tools for academic success
Step: 2

Step: 3
Ace Your Homework with AI
Get the answers you need in no time with our AI-driven, step-by-step assistance
Get Started