

Answered step by step
Verified Expert Solution
Question
1 Approved Answer
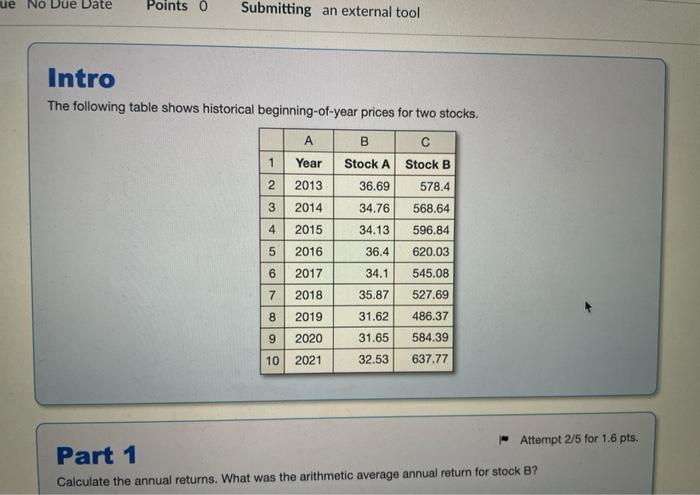
ue No Due Date Points 0 Submitting an external tool Intro The following table shows historical beginning-of-year prices for two stocks. B 1 Year Stock
Step by Step Solution
There are 3 Steps involved in it
Step: 1

Get Instant Access to Expert-Tailored Solutions
See step-by-step solutions with expert insights and AI powered tools for academic success
Step: 2

Step: 3
Ace Your Homework with AI
Get the answers you need in no time with our AI-driven, step-by-step assistance
Get Started
Weathering The Storm A Quick Guide To Safeguarding Your Finances During Economic Recession
Authors: Liam Wilhelm
1st Edition
979-8864393628