 undefined
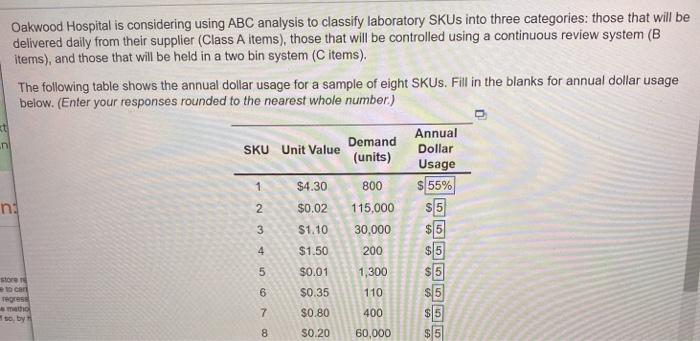
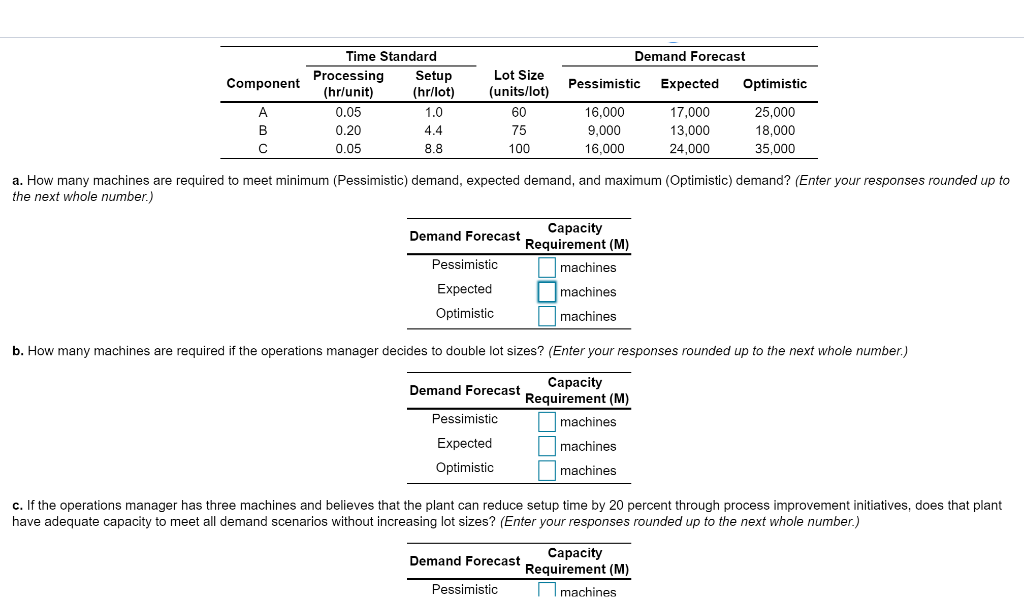
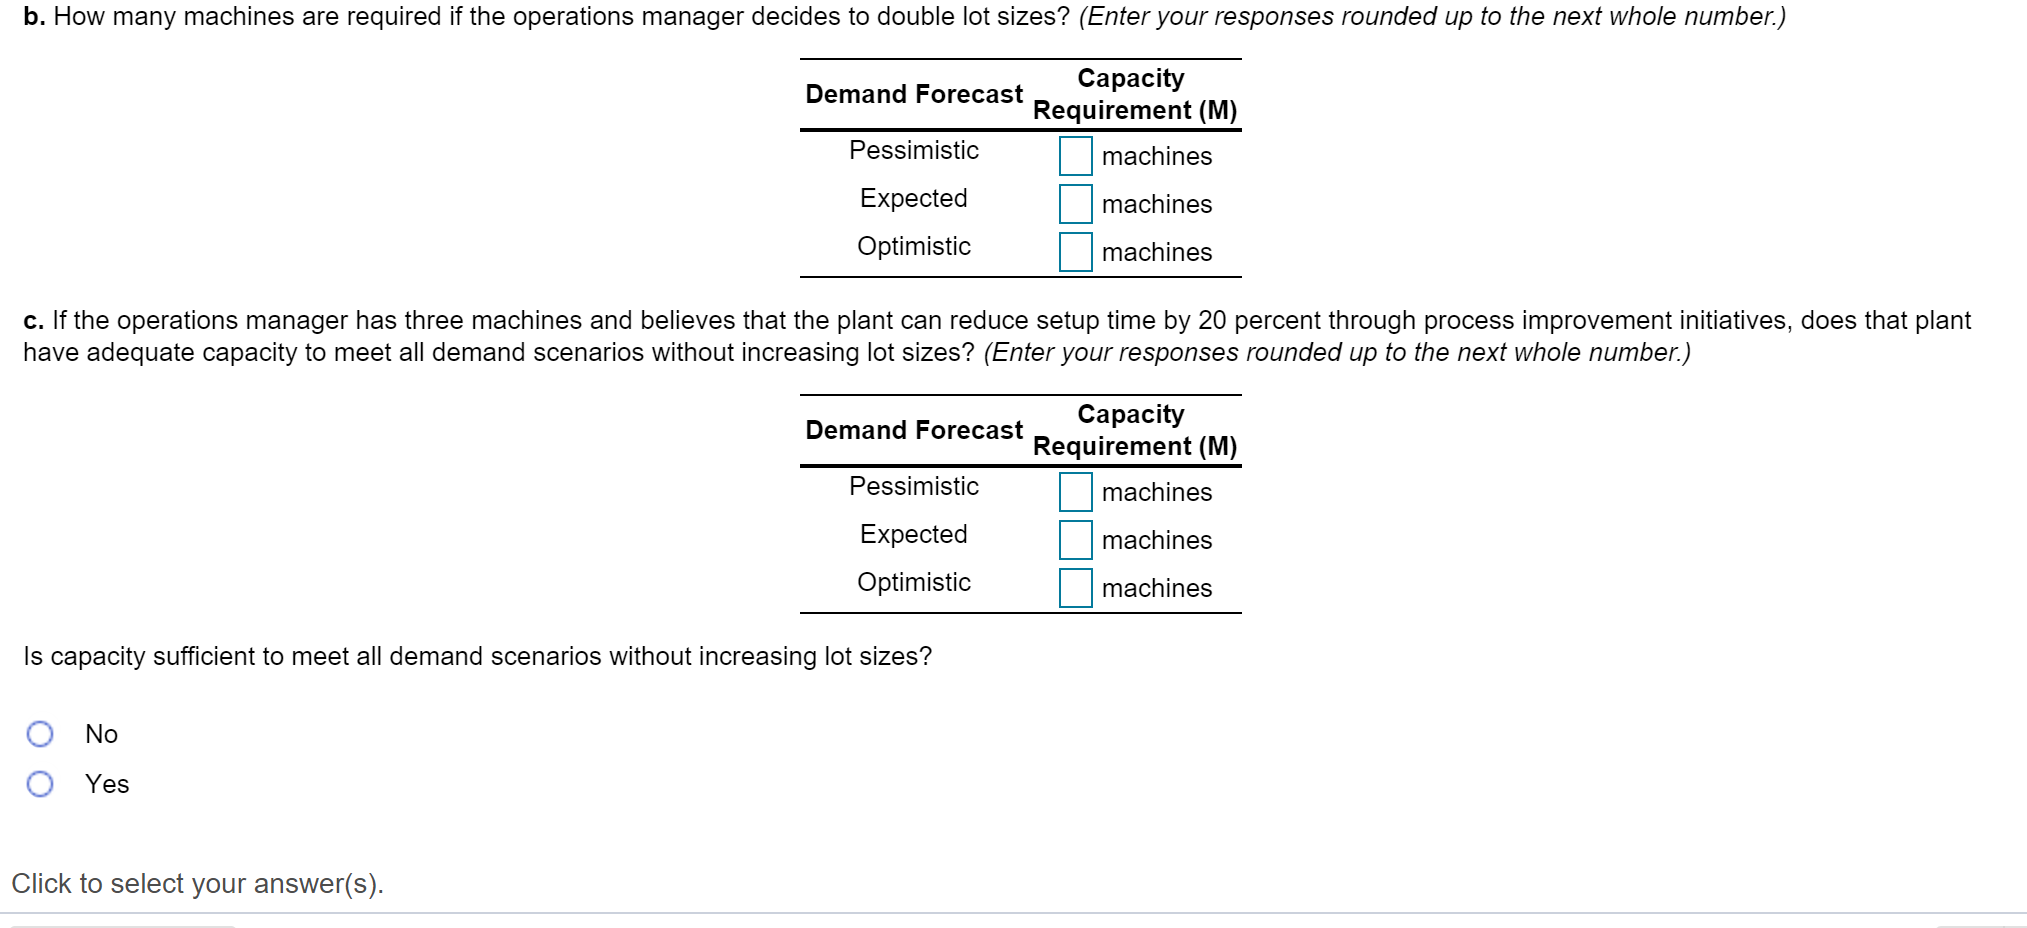
Demand Forecast Component Pessimistic Expected Optimistic Time Standard Processing Setup (hr/unit) (hr/lot) 1.0 0.20 4.4 0.05 8.8 A 0.05 Lot Size (units/lot) 60 75 100 B 16,000 9,000 16,000 17,000 13,000 24,000 25,000 18,000 35,000 C a. How many machines are required to meet minimum (Pessimistic) demand, expected demand, and maximum (Optimistic) demand? (Enter your responses rounded up to the next whole number.) Capacity Demand Forecast Requirement (M) Pessimistic machines Expected machines Optimistic machines b. How many machines are required if the operations manager decides to double lot sizes? (Enter your responses rounded up to the next whole number.) Capacity Demand Forecast Requirement (M) Pessimistic machines Expected machines Optimistic machines c. If the operations manager has three machines and believes that the plant can reduce setup time by 20 percent through process improvement initiatives, does that plant have adequate capacity to meet all demand scenarios without increasing lot sizes? (Enter your responses rounded up to the next whole number.) Demand Forecast Capacity Requirement (M) Pessimistic machines b. How many machines are required if the operations manager decides to double lot sizes? (Enter your responses rounded up to the next whole number.) Demand Forecast Capacity Requirement (M) Pessimistic machines Expected machines Optimistic machines c. If the operations manager has three machines and believes that the plant can reduce setup time by 20 percent through process improvement initiatives, does that plant have adequate capacity to meet all demand scenarios without increasing lot sizes? (Enter your responses rounded up to the next whole number.) Capacity Demand Forecast Requirement (M) Pessimistic machines machines Expected Optimistic machines Is capacity sufficient to meet all demand scenarios without increasing lot sizes? No Yes Click to select your answer(s). Oakwood Hospital is considering using ABC analysis to classify laboratory SKUs into three categories: those that will be delivered daily from their supplier (Class A items), those that will be controlled using a continuous review system (B items), and those that will be held in a two bin system (C items). The following table shows the annual dollar usage for a sample of eight SKUs. Fill in the blanks for annual dollar usage below. (Enter your responses rounded to the nearest whole number) .nl SKU Unit Value Demand (units) 1 800 $4.30 $0.02 Annual Dollar Usage $ 55% $5 $ 5 n: $1.10 115,000 30.000 200 $1.50 VON 30.01 1,300 store 1 CAN 110 $0.35 $0.80 th Tsoby 400 $5 8 $0.20 60,000 Demand Forecast Component Pessimistic Expected Optimistic Time Standard Processing Setup (hr/unit) (hr/lot) 1.0 0.20 4.4 0.05 8.8 A 0.05 Lot Size (units/lot) 60 75 100 B 16,000 9,000 16,000 17,000 13,000 24,000 25,000 18,000 35,000 C a. How many machines are required to meet minimum (Pessimistic) demand, expected demand, and maximum (Optimistic) demand? (Enter your responses rounded up to the next whole number.) Capacity Demand Forecast Requirement (M) Pessimistic machines Expected machines Optimistic machines b. How many machines are required if the operations manager decides to double lot sizes? (Enter your responses rounded up to the next whole number.) Capacity Demand Forecast Requirement (M) Pessimistic machines Expected machines Optimistic machines c. If the operations manager has three machines and believes that the plant can reduce setup time by 20 percent through process improvement initiatives, does that plant have adequate capacity to meet all demand scenarios without increasing lot sizes? (Enter your responses rounded up to the next whole number.) Demand Forecast Capacity Requirement (M) Pessimistic machines b. How many machines are required if the operations manager decides to double lot sizes? (Enter your responses rounded up to the next whole number.) Demand Forecast Capacity Requirement (M) Pessimistic machines Expected machines Optimistic machines c. If the operations manager has three machines and believes that the plant can reduce setup time by 20 percent through process improvement initiatives, does that plant have adequate capacity to meet all demand scenarios without increasing lot sizes? (Enter your responses rounded up to the next whole number.) Capacity Demand Forecast Requirement (M) Pessimistic machines machines Expected Optimistic machines Is capacity sufficient to meet all demand scenarios without increasing lot sizes? No Yes Click to select your answer(s). Oakwood Hospital is considering using ABC analysis to classify laboratory SKUs into three categories: those that will be delivered daily from their supplier (Class A items), those that will be controlled using a continuous review system (B items), and those that will be held in a two bin system (C items). The following table shows the annual dollar usage for a sample of eight SKUs. Fill in the blanks for annual dollar usage below. (Enter your responses rounded to the nearest whole number) .nl SKU Unit Value Demand (units) 1 800 $4.30 $0.02 Annual Dollar Usage $ 55% $5 $ 5 n: $1.10 115,000 30.000 200 $1.50 VON 30.01 1,300 store 1 CAN 110 $0.35 $0.80 th Tsoby 400 $5 8 $0.20 60,000