 undefined
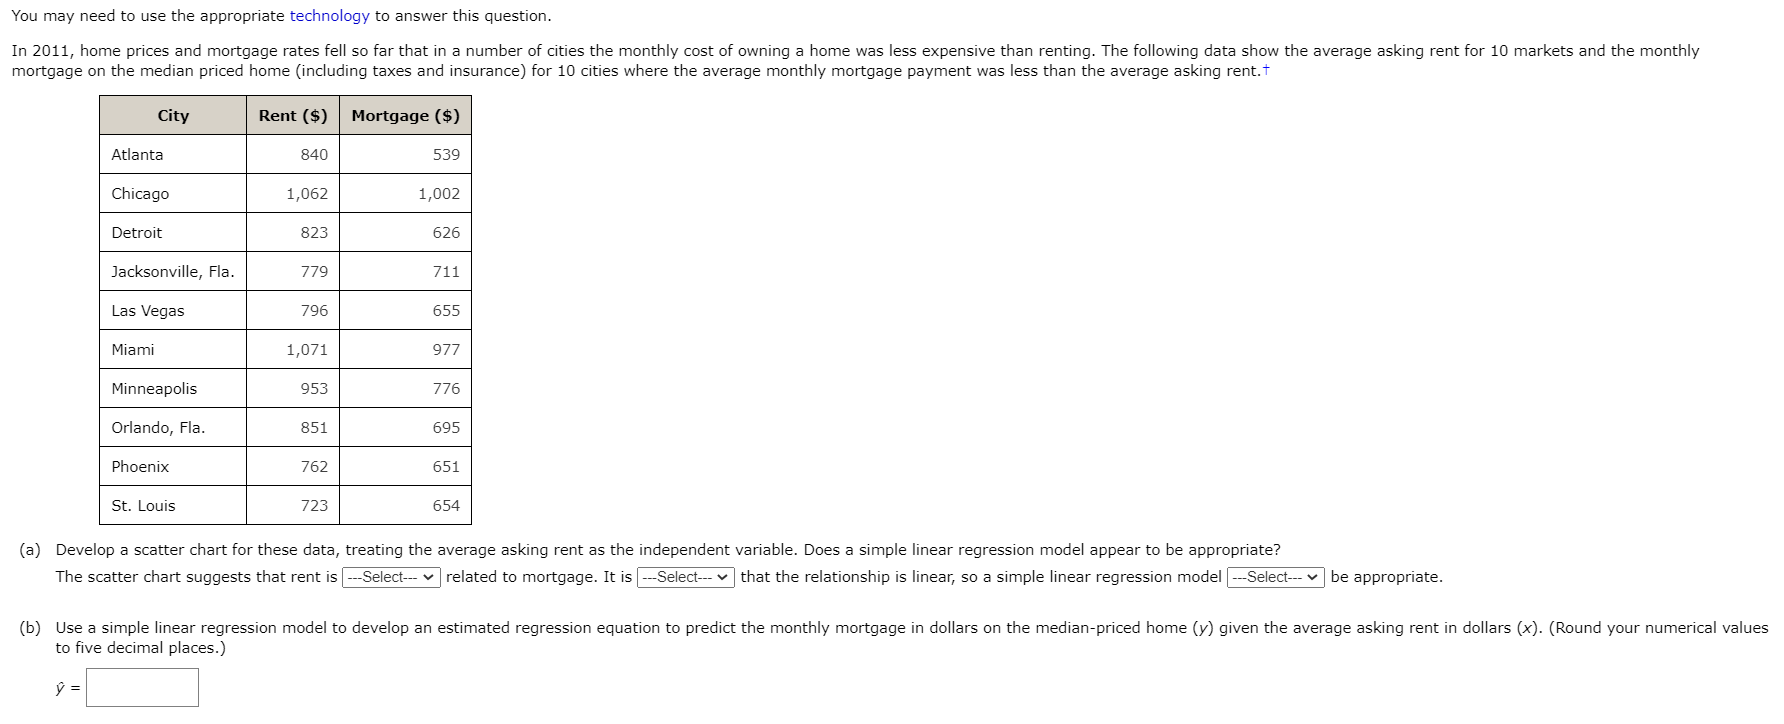
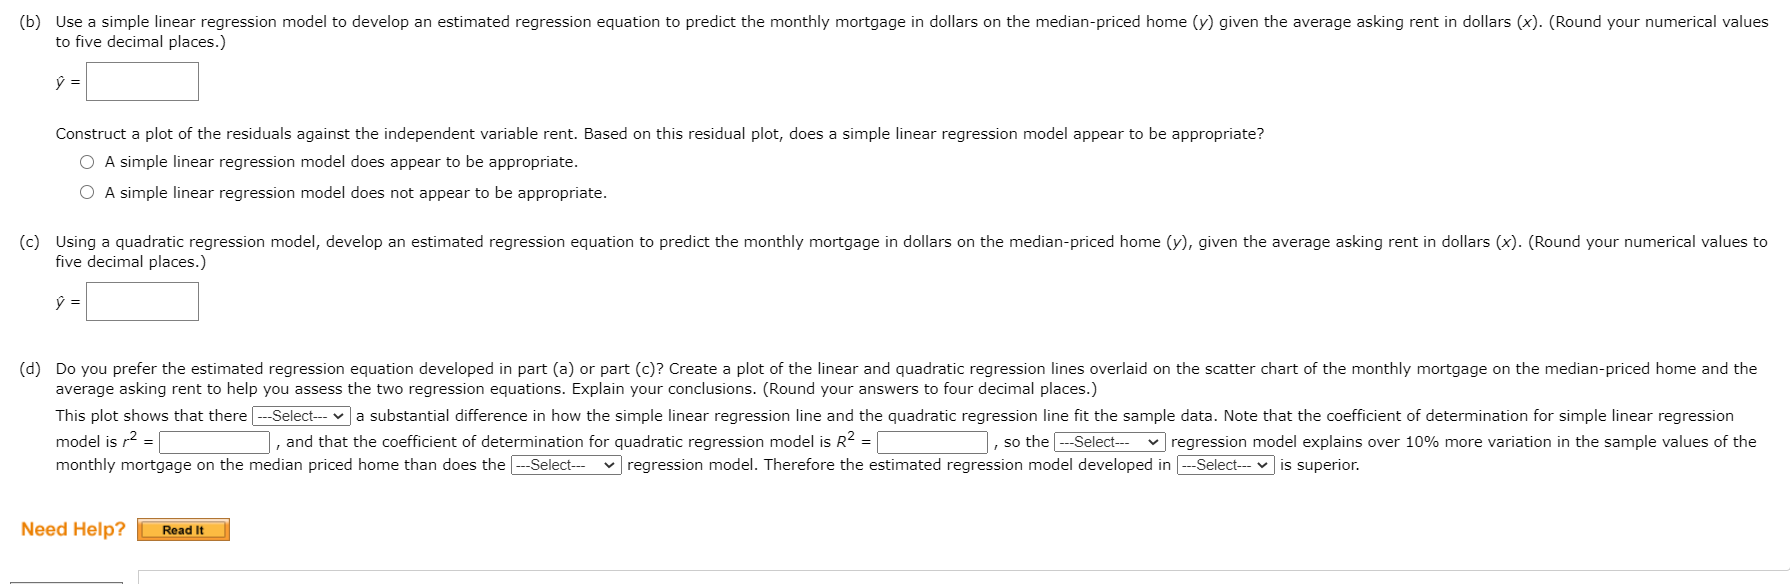
You may need to use the appropriate technology to answer this question. In 2011, home prices and mortgage rates fell so far that in a number of cities the monthly cost of owning a home was less expensive than renting. The following data show the average asking rent for 10 markets and the monthly mortgage on the median priced home (including taxes and insurance) for 10 cities where the average monthly mortgage payment was less than the average asking rent. City Rent ($) | Mortgage ($) Atlanta 840 539 Chicago 1,062 1,002 Detroit 823 626 Jacksonville, Fla. 779 711 Las Vegas 796 655 Miami 1,071 977 Minneapolis 953 776 Orlando, Fla. 851 695 Phoenix 762 651 St. Louis 723 654 (a) Develop a scatter chart for these data, treating the average asking rent as the independent variable. Does a simple linear regression model appear to be appropriate? The scatter chart suggests that rent is --Select--- related to mortgage. It is --Select-- that the relationship is linear, so a simple linear regression model --Select---be appropriate. (b) Use a simple linear regression model to develop an estimated regression equation to predict the monthly mortgage in dollars on the median-priced home (y) given the average asking rent in dollars (x). (Round your numerical values to five decimal places.) = (b) Use a simple linear regression model to develop an estimated regression equation to predict the monthly mortgage in dollars on the median-priced home (y) given the average asking rent in dollars (X). (Round your numerical values to five decimal places.) = Construct a plot of the residuals against the independent variable rent. Based on this residual plot, does a simple linear regression model appear to be appropriate? O A simple linear regression model does appear to be appropriate. A simple linear regression model does not appear to be appropriate. (c) Using a quadratic regression model, develop an estimated regression equation to predict the monthly mortgage in dollars on the median-priced home (y), given the average asking rent in dollars (X). (Round your numerical values to five decimal places.) = (d) Do you prefer the estimated regression equation developed in part (a) or part (c)? Create a plot of the linear and quadratic regression lines overlaid on the scatter chart of the monthly mortgage on the median-priced home and the average asking rent to help you assess the two regression equations. Explain your conclusions. (Round your answers to four decimal places.) This plot shows that there ---Select--- va substantial difference in how the simple linear regression line and the quadratic regression line fit the sample data. Note that the coefficient of determination for simple linear regression model is 2 = , and that the coefficient of determination for quadratic regression model is R2 = so the ---Select--- regression model explains over 10% more variation in the sample values of the monthly mortgage on the median priced home than does the ---Select-- regression model. Therefore the estimated regression model developed in ---Select--- is superior. Need Help? Read It You may need to use the appropriate technology to answer this question. In 2011, home prices and mortgage rates fell so far that in a number of cities the monthly cost of owning a home was less expensive than renting. The following data show the average asking rent for 10 markets and the monthly mortgage on the median priced home (including taxes and insurance) for 10 cities where the average monthly mortgage payment was less than the average asking rent. City Rent ($) | Mortgage ($) Atlanta 840 539 Chicago 1,062 1,002 Detroit 823 626 Jacksonville, Fla. 779 711 Las Vegas 796 655 Miami 1,071 977 Minneapolis 953 776 Orlando, Fla. 851 695 Phoenix 762 651 St. Louis 723 654 (a) Develop a scatter chart for these data, treating the average asking rent as the independent variable. Does a simple linear regression model appear to be appropriate? The scatter chart suggests that rent is --Select--- related to mortgage. It is --Select-- that the relationship is linear, so a simple linear regression model --Select---be appropriate. (b) Use a simple linear regression model to develop an estimated regression equation to predict the monthly mortgage in dollars on the median-priced home (y) given the average asking rent in dollars (x). (Round your numerical values to five decimal places.) = (b) Use a simple linear regression model to develop an estimated regression equation to predict the monthly mortgage in dollars on the median-priced home (y) given the average asking rent in dollars (X). (Round your numerical values to five decimal places.) = Construct a plot of the residuals against the independent variable rent. Based on this residual plot, does a simple linear regression model appear to be appropriate? O A simple linear regression model does appear to be appropriate. A simple linear regression model does not appear to be appropriate. (c) Using a quadratic regression model, develop an estimated regression equation to predict the monthly mortgage in dollars on the median-priced home (y), given the average asking rent in dollars (X). (Round your numerical values to five decimal places.) = (d) Do you prefer the estimated regression equation developed in part (a) or part (c)? Create a plot of the linear and quadratic regression lines overlaid on the scatter chart of the monthly mortgage on the median-priced home and the average asking rent to help you assess the two regression equations. Explain your conclusions. (Round your answers to four decimal places.) This plot shows that there ---Select--- va substantial difference in how the simple linear regression line and the quadratic regression line fit the sample data. Note that the coefficient of determination for simple linear regression model is 2 = , and that the coefficient of determination for quadratic regression model is R2 = so the ---Select--- regression model explains over 10% more variation in the sample values of the monthly mortgage on the median priced home than does the ---Select-- regression model. Therefore the estimated regression model developed in ---Select--- is superior. Need Help? Read It