

Question
under Q7 is my botched attempt at creating a new array to join to the pre-existing table made in Q4. This was Written in Python
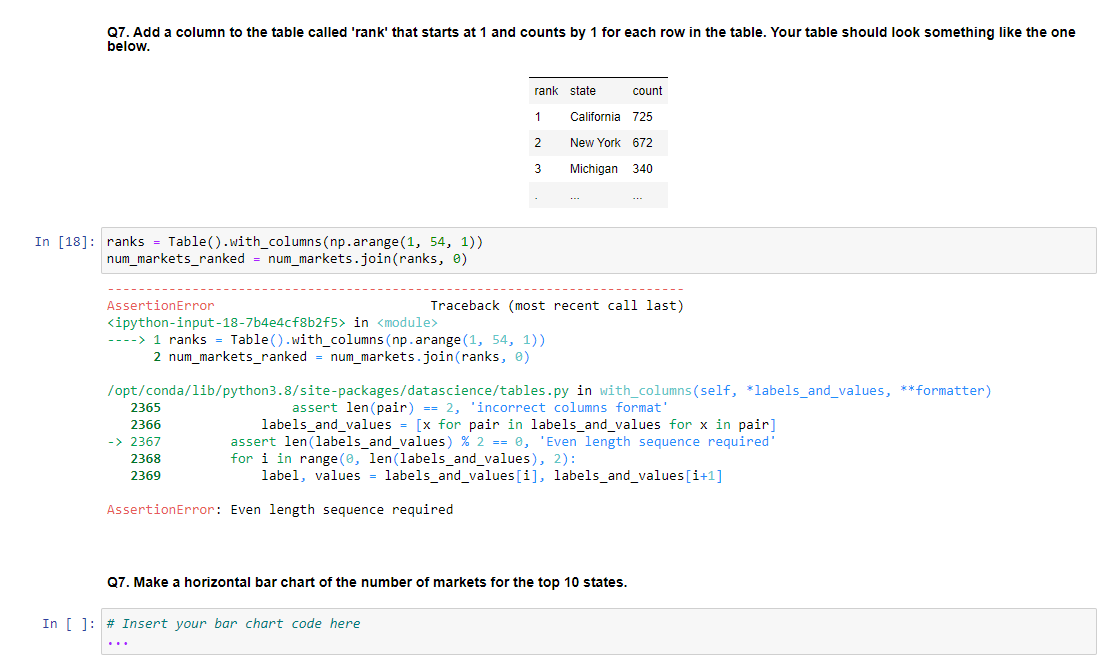 under Q7 is my botched attempt at creating a new array to join to the pre-existing table made in Q4. This was Written in Python 3. I am looking for a SIMPLE way to solve this problem. Try to avoid pandas, as pandas and numpy seem to not work very well together. If you'd like to include Q7.1, you may. I'm not picky. I'm just stuck on Q7 Q4: Create a table called num_markets that has 2 columns. The first column 'State' has the name of each state and the second column 'count' has the number of markets in that state. Sort the table by 'count' in descending order.
Q7: Add a column to the table called 'rank' that starts at 1 and counts by 1 for each row in the table. Your table should look something like the one below.
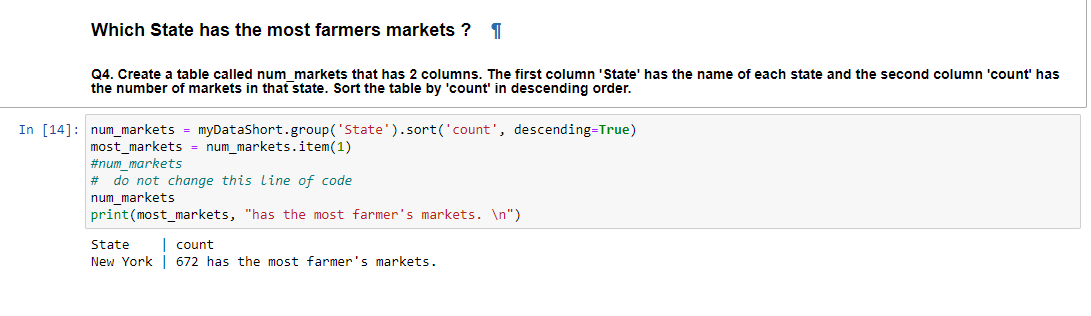
Which State has the most farmers markets ? I Q4. Create a table called num_markets that has 2 columns. The first column 'State' has the name of each state and the second column 'count' has the number of markets in that state. Sort the table by 'count' in descending order. ]: num_markets = myDatashort.group('State').sort('count', descending=True) most_markets = num_markets.item(1) \#num_markets \# do not change this line of code num_markets print(most_markets, "has the most farmer's markets. ) State | count New York | 672 has the most farmer's markets. Q7. Add a column to the table called 'rank' that starts at 1 and counts by 1 for each row in the table. Your table should look something like the one below. Q7. Make a horizontal bar chart of the number of markets for the top 10 states. ]: \# Insert your bar chart code hereStep by Step Solution
There are 3 Steps involved in it
Step: 1

Get Instant Access to Expert-Tailored Solutions
See step-by-step solutions with expert insights and AI powered tools for academic success
Step: 2

Step: 3
Ace Your Homework with AI
Get the answers you need in no time with our AI-driven, step-by-step assistance
Get Started
Database And Expert Systems Applications 24th International Conference Dexa 2013 Prague Czech Republic August 2013 Proceedings Part 1 Lncs 8055
Authors: Hendrik Decker ,Lenka Lhotska ,Sebastian Link ,Josef Basl ,A Min Tjoa
2013 Edition
3642402844, 978-3642402845