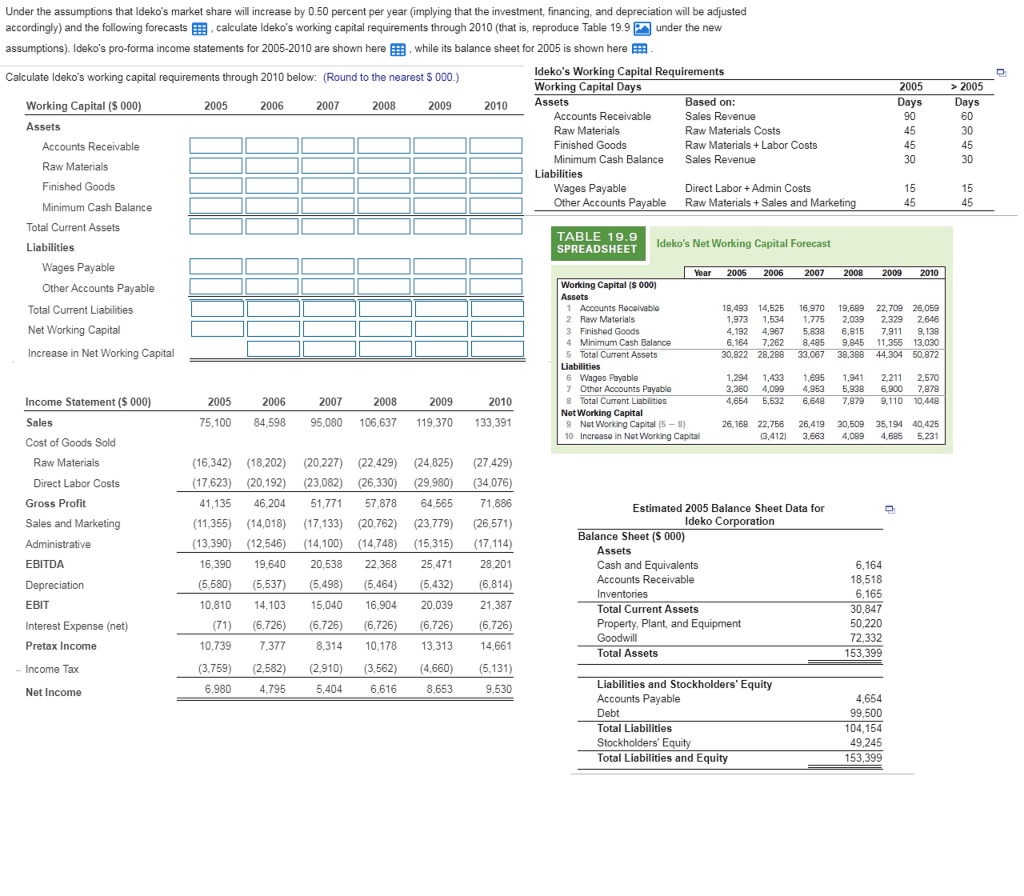
Under the assumptions that Ideko's market share will increase by 0.50 percent per year (implying that the investment, financing, and depreciation will be adjusted accordingly) and the following forecasts Ecalculate Ideko's working capital requirements through 2010 (that is, reproduce Table 19.9under the new assumptions). Ideko's pro-forma income statements for 2005-2010 are shown here EEB, while its balance sheet for 2005 is shown here EEE Ideko's Working Capital Requirements Working Capital Days Calculate Ideko's working capital requirements through 2010 below: Round to the nearest S 000.) 2005 Based on: Sales Revenue Raw Materials Costs Raw Materials+Labor Costs Sales Revenue Working Capital (S 000) 2007 2008 2009 2010 Assets Accounts Receivable Raw Materials Finished Goods Minimum Cash Balance 45 45 30 45 30 Accounts Receivable Raw Materials Finished Goods Minimum Cash Balance Liabilities Direct LaborAdmin Costs Raw Materials+ Sales and Other Accounts Payable Total Current Assets TABLE 19.9 SPREADSHEET Liabilities Ideko's Net Working Capital Forecast Wages Payable Year 2005 2006 2007 2008 2009 2010 Working Capital (S 000) Other Accounts Payable Total Current Liabilities Net Working Capital Increase in Net Working Capital 1 Accounts Rocoivablo 2 Raw Materials 3 Finished Goods 4 Minimum Cash Balance 5 Total Current Assets 18,493 14,525 6,970 19,689 22,709 26,059 1,973 1,534 775 2.039 2,329 2646 4.192 4,967 5838 6,815 7.911 9,138 6,164 7.262 8.485 9,845 11355 13,030 30,822 28,288 33,067 38,388 44,304 50,872 6 Wages Payable 7 Other Accounts Payable 8 Total Curront Liabilitios 1,294 1,433 1,695 1,94 2,211 2,570 3,360 4,099 4,953 6,93 6,900 7,879 4,664 6,532 6,648 7,879 9,110 10.,448 Income Statement ($ 000 Sales Cost of Goods Sold 2008 2009 2010 Net Working Capital 75,100 84,598 95,080 106,637 119,370 133,391 9 Not Working Capital (5- 8) Increase in Not Working Capital 26,168 22,756 26,419 30,509 35,194 40,425 3.412 3,663 4,089 4,685 5,231 10 Raw Materials (16,342) 18,202) (20,227) (22,429) (24,825) 27,429) (17,623) (20,192) (23,082) (26,330) (29,980) 34,076) 41,135 46,204 51,771 57,878 64,565 71,886 (11,355) (14,018 7,133 (20,762) (23,779) (26,571) (13,390) (12,546) 14,100 (14,748) (15,315) 17,114) 6,390 19,640 20,538 22,368 25,471 28,201 (5,580) (5,537) (5,498) 5,464) 5,432) 6,814) 0,810 14,103 5,040 16,904 20,039 21,387 (71) (6,726) (6,726 6,726 (6,726) 6,726) 0,739 7,377 8,314 10.178 13.313 14,661 (3,759) (2,582 2,910) 3,562) 4,660) 5,131) Direct Labor Costs Gross Profit Sales and Marketing Administrative EBITDA Estimated 2005 Balance Sheet Data for Ideko Corporation Balance Sheet (S 000) Assets Cash and Equivalents Accounts Receivable 18,518 6,165 30,847 50,220 Total Current Assets Property, Plant, and Equipment Interest Expense (net) Pretax Income Total Assets 153,399 Income lax Liabilities and Stockholders' Equity Accounts Payable Debt Total Liabilities Stockholders' Equity Total Liabilities and Equity Net Income 8,653 99,500 104,15 49.245 153,399 Under the assumptions that Ideko's market share will increase by 0.50 percent per year (implying that the investment, financing, and depreciation will be adjusted accordingly) and the following forecasts Ecalculate Ideko's working capital requirements through 2010 (that is, reproduce Table 19.9under the new assumptions). Ideko's pro-forma income statements for 2005-2010 are shown here EEB, while its balance sheet for 2005 is shown here EEE Ideko's Working Capital Requirements Working Capital Days Calculate Ideko's working capital requirements through 2010 below: Round to the nearest S 000.) 2005 Based on: Sales Revenue Raw Materials Costs Raw Materials+Labor Costs Sales Revenue Working Capital (S 000) 2007 2008 2009 2010 Assets Accounts Receivable Raw Materials Finished Goods Minimum Cash Balance 45 45 30 45 30 Accounts Receivable Raw Materials Finished Goods Minimum Cash Balance Liabilities Direct LaborAdmin Costs Raw Materials+ Sales and Other Accounts Payable Total Current Assets TABLE 19.9 SPREADSHEET Liabilities Ideko's Net Working Capital Forecast Wages Payable Year 2005 2006 2007 2008 2009 2010 Working Capital (S 000) Other Accounts Payable Total Current Liabilities Net Working Capital Increase in Net Working Capital 1 Accounts Rocoivablo 2 Raw Materials 3 Finished Goods 4 Minimum Cash Balance 5 Total Current Assets 18,493 14,525 6,970 19,689 22,709 26,059 1,973 1,534 775 2.039 2,329 2646 4.192 4,967 5838 6,815 7.911 9,138 6,164 7.262 8.485 9,845 11355 13,030 30,822 28,288 33,067 38,388 44,304 50,872 6 Wages Payable 7 Other Accounts Payable 8 Total Curront Liabilitios 1,294 1,433 1,695 1,94 2,211 2,570 3,360 4,099 4,953 6,93 6,900 7,879 4,664 6,532 6,648 7,879 9,110 10.,448 Income Statement ($ 000 Sales Cost of Goods Sold 2008 2009 2010 Net Working Capital 75,100 84,598 95,080 106,637 119,370 133,391 9 Not Working Capital (5- 8) Increase in Not Working Capital 26,168 22,756 26,419 30,509 35,194 40,425 3.412 3,663 4,089 4,685 5,231 10 Raw Materials (16,342) 18,202) (20,227) (22,429) (24,825) 27,429) (17,623) (20,192) (23,082) (26,330) (29,980) 34,076) 41,135 46,204 51,771 57,878 64,565 71,886 (11,355) (14,018 7,133 (20,762) (23,779) (26,571) (13,390) (12,546) 14,100 (14,748) (15,315) 17,114) 6,390 19,640 20,538 22,368 25,471 28,201 (5,580) (5,537) (5,498) 5,464) 5,432) 6,814) 0,810 14,103 5,040 16,904 20,039 21,387 (71) (6,726) (6,726 6,726 (6,726) 6,726) 0,739 7,377 8,314 10.178 13.313 14,661 (3,759) (2,582 2,910) 3,562) 4,660) 5,131) Direct Labor Costs Gross Profit Sales and Marketing Administrative EBITDA Estimated 2005 Balance Sheet Data for Ideko Corporation Balance Sheet (S 000) Assets Cash and Equivalents Accounts Receivable 18,518 6,165 30,847 50,220 Total Current Assets Property, Plant, and Equipment Interest Expense (net) Pretax Income Total Assets 153,399 Income lax Liabilities and Stockholders' Equity Accounts Payable Debt Total Liabilities Stockholders' Equity Total Liabilities and Equity Net Income 8,653 99,500 104,15 49.245 153,399