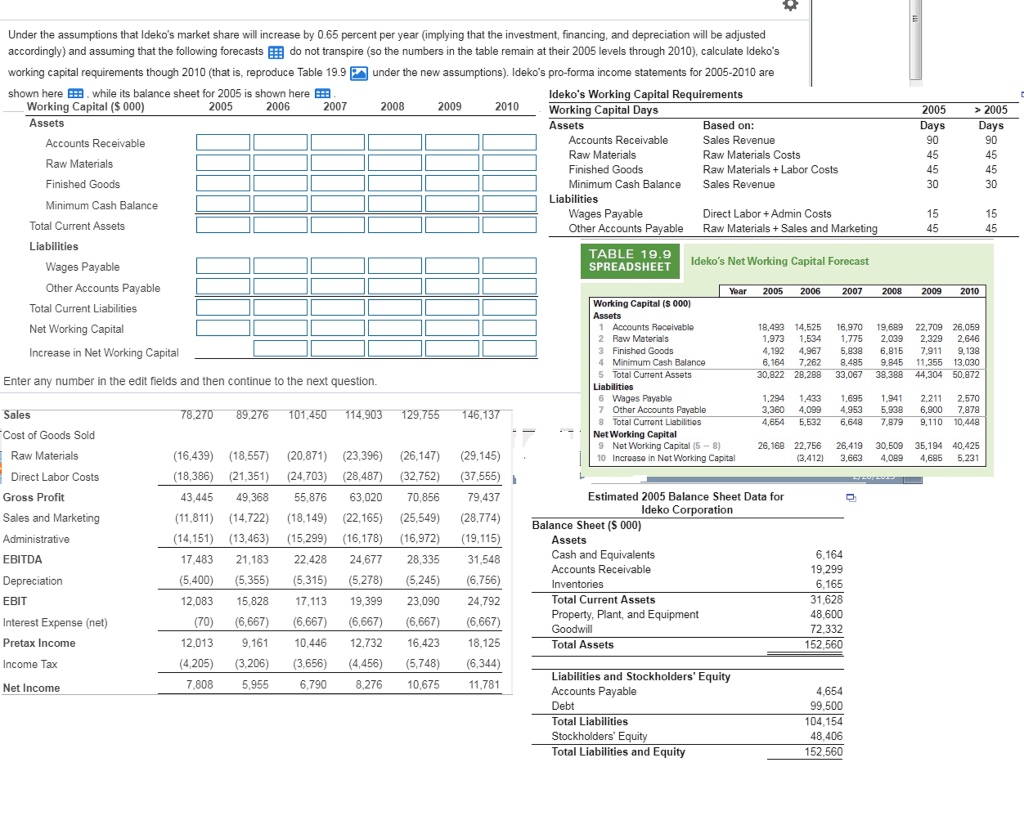
Under the assumptions that Ideko's market share will increase by 0.65 percent per year (implying that the investment, financing, and depreciation will be adjusted accordingly and assuming that the following forecastsdo not transpire so the numbers in the table remain at their 2005 levels through 2010 calculate ldeko's working capital requirements though 2010 (that is, reproduce Table 19.9under the new assumptions). Ideko's pro-forma income statements for 2005-2010 are shown here E. while its balance sheet for 2005 is shown here E Working Capital (S 000) Assets Ideko's Working Capital Requirements Working Capital Days Assets 2005 2006 2009 2010 Based on: Sales Revenue Raw Materials Costs Raw Materials+Labor Costs Sales Revenue Accounts Receivable Accounts Receivable Raw Materials Finished Goods Minimum Cash Balance 90 90 aw Finished Goods Minimum Cash Balance 30 30 Liabilities Wages Payable Other Accounts Payable Direct LaborAdmin Costs Raw Materials+Sales and Marketing 15 Total Current Assets Liabilities TABLE 19.9 SPREADSHEET Ideko's Net Working Capital Forecast Wages Payable Other Accounts Payable Total Current Liabilities Net Working Capital Increase in Net Working Capital Yoar 2005 2006 20072008 2009 2010 Working Capital (S 000) 1 Accounts Rocoivable 18,493 14,525 16,970 19,689 22,709 26,059 1,973 1,534 775 2039 2,329 2,646 4,192 4,967 5,83 6,816 7,911 9,138 6,164 7,262 8,485 9.845 11,355 13,030 30,822 28,288 33,067 38,388 44,304 50,872 2 Raw Materials 3 Finished Goods 4 Minimum Cash Belance 5 Total Current Assets Enter any number in the edit fields and then continue to the next question. 6 Wages Payable 7 Other Accounts Payable 8 Total Curront Liabilitios 1,294 1433 695 1941 2.211 2,570 3,360 4,099 4,953 5,938 6,900 7,878 4,654 6,532 6,648 7,879 9,110 10,448 Cost of Goods Sold Net Working Capital 9 Net Working Capital (5-8) Incroase in Not Working Capital 26,168 22,756 26,419 30,509 35,194 40,425 (3,412 3,663 09 4,685 5,231 Raw Materials (16,439) (18,557) (20,871) (23,396) 26,147) (29,145) 18,386 21,35) (24,703) (28,487) (32,752) (37,555) 43,445 49,368 55,876 63,020 70,856 79,437 11,811) 14722 (18,149) (22,165) (25,549) (28,774) (14,15) 13,463 15,299) 16,178) 16,972) (19,115) 7,483 21,183 22,428 24,677 28,335 31,548 (5,400) (5,355 5,31 (5,278) 5,245) 6,756) 2,083 15,828 17,113 19,399 23,090 24,792 (70) (6,667) 6,667) 6,667) 6,6676,667) 12.013 9,16110,446 12,732 16,423 18,125 (4,205) 3,206 3,656 (4,456) 5,748) 6,344) 10 Direct Labor Costs Estimated 2005 Balance Sheet Data for Ideko Corporation Gross Profit Sales and Marketing Balance Sheet (S 000) Assets Cash and Equivalents Accounts Receivable EBITDA 19,299 31,628 72.332 Total Current Assets Property, Plant, and Equipment Interest Expense (net) Pretax Income Income Tax Net Income Total Assets 152,560 Liabilities and Stockholders' Equity Accounts Payable Debt Total Liabilities Stockholders' Equity Total Liabilities and Equity 8,276 10,675 99.500 48,406 Under the assumptions that Ideko's market share will increase by 0.65 percent per year (implying that the investment, financing, and depreciation will be adjusted accordingly and assuming that the following forecastsdo not transpire so the numbers in the table remain at their 2005 levels through 2010 calculate ldeko's working capital requirements though 2010 (that is, reproduce Table 19.9under the new assumptions). Ideko's pro-forma income statements for 2005-2010 are shown here E. while its balance sheet for 2005 is shown here E Working Capital (S 000) Assets Ideko's Working Capital Requirements Working Capital Days Assets 2005 2006 2009 2010 Based on: Sales Revenue Raw Materials Costs Raw Materials+Labor Costs Sales Revenue Accounts Receivable Accounts Receivable Raw Materials Finished Goods Minimum Cash Balance 90 90 aw Finished Goods Minimum Cash Balance 30 30 Liabilities Wages Payable Other Accounts Payable Direct LaborAdmin Costs Raw Materials+Sales and Marketing 15 Total Current Assets Liabilities TABLE 19.9 SPREADSHEET Ideko's Net Working Capital Forecast Wages Payable Other Accounts Payable Total Current Liabilities Net Working Capital Increase in Net Working Capital Yoar 2005 2006 20072008 2009 2010 Working Capital (S 000) 1 Accounts Rocoivable 18,493 14,525 16,970 19,689 22,709 26,059 1,973 1,534 775 2039 2,329 2,646 4,192 4,967 5,83 6,816 7,911 9,138 6,164 7,262 8,485 9.845 11,355 13,030 30,822 28,288 33,067 38,388 44,304 50,872 2 Raw Materials 3 Finished Goods 4 Minimum Cash Belance 5 Total Current Assets Enter any number in the edit fields and then continue to the next question. 6 Wages Payable 7 Other Accounts Payable 8 Total Curront Liabilitios 1,294 1433 695 1941 2.211 2,570 3,360 4,099 4,953 5,938 6,900 7,878 4,654 6,532 6,648 7,879 9,110 10,448 Cost of Goods Sold Net Working Capital 9 Net Working Capital (5-8) Incroase in Not Working Capital 26,168 22,756 26,419 30,509 35,194 40,425 (3,412 3,663 09 4,685 5,231 Raw Materials (16,439) (18,557) (20,871) (23,396) 26,147) (29,145) 18,386 21,35) (24,703) (28,487) (32,752) (37,555) 43,445 49,368 55,876 63,020 70,856 79,437 11,811) 14722 (18,149) (22,165) (25,549) (28,774) (14,15) 13,463 15,299) 16,178) 16,972) (19,115) 7,483 21,183 22,428 24,677 28,335 31,548 (5,400) (5,355 5,31 (5,278) 5,245) 6,756) 2,083 15,828 17,113 19,399 23,090 24,792 (70) (6,667) 6,667) 6,667) 6,6676,667) 12.013 9,16110,446 12,732 16,423 18,125 (4,205) 3,206 3,656 (4,456) 5,748) 6,344) 10 Direct Labor Costs Estimated 2005 Balance Sheet Data for Ideko Corporation Gross Profit Sales and Marketing Balance Sheet (S 000) Assets Cash and Equivalents Accounts Receivable EBITDA 19,299 31,628 72.332 Total Current Assets Property, Plant, and Equipment Interest Expense (net) Pretax Income Income Tax Net Income Total Assets 152,560 Liabilities and Stockholders' Equity Accounts Payable Debt Total Liabilities Stockholders' Equity Total Liabilities and Equity 8,276 10,675 99.500 48,406