Understanding statistical measures of risk is fundamental to understanding investing. In particular, a stock's CAPM beta coefficient (?) and R2 value are two important risk
Understanding statistical measures of risk is fundamental to understanding investing. In particular, a stock's CAPM beta coefficient (?) and R2 value are two important risk measures. Beta measures the degree to which stock and benchmark returns move together, while the coefficient of determination, or R2, represents the strength of the relationship between the stock and the benchmark. The Beta Visualization application provides a rich graphical interface to help visualize and interpret the relationship between the CAPM beta coefficient and R2.
Access the Beta Visualization platform and answer the following questions:
BETA VISUALIZATION PLATFORM:

1. Information Technology industry
a. locate the highest and lowest beta stocks in the Information Technology industry
b. find the corresponding R2 values for the highest and lowest beta stock.
2. Which industries have the highest and lowest average industry beta?
3. Which industry has an average industry beta closest to the market beta?
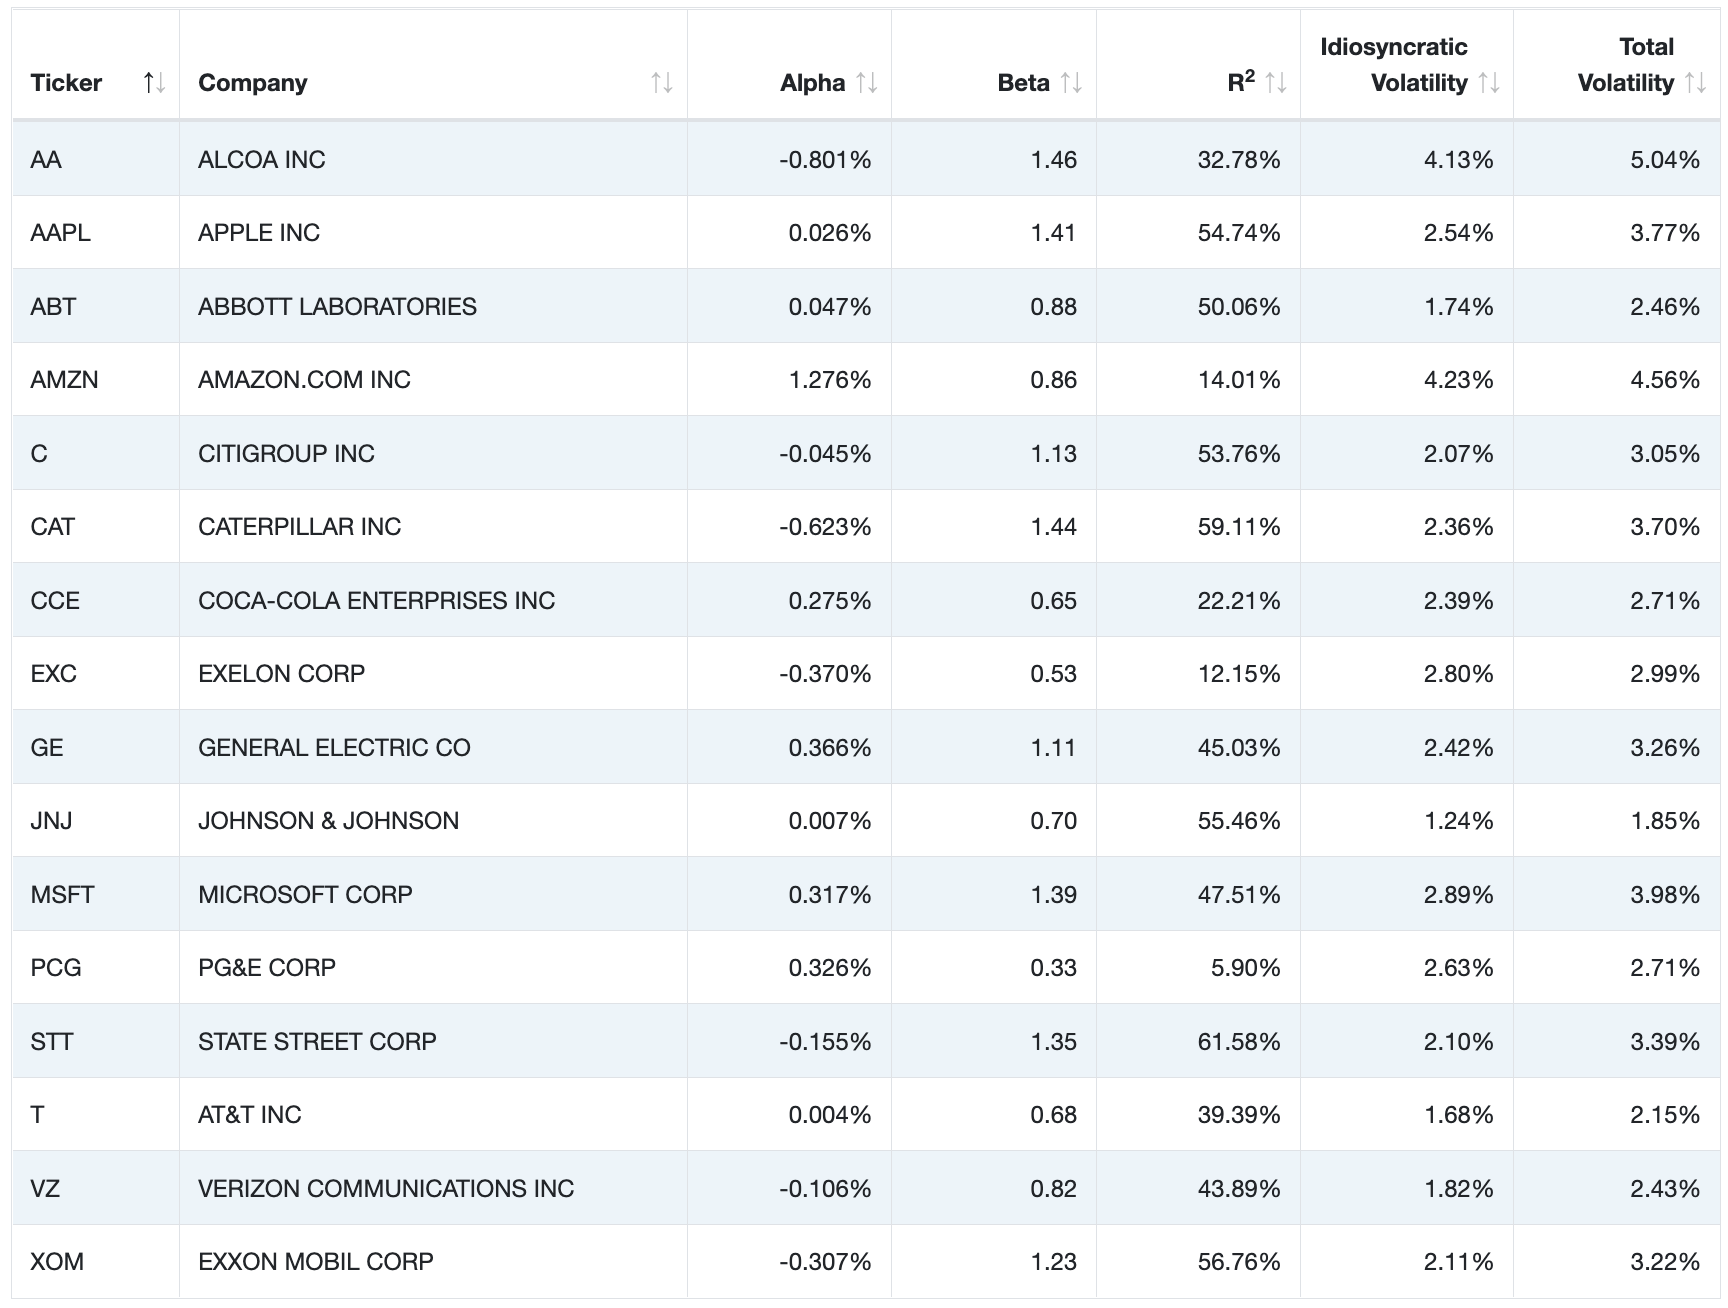
Ticker Company AA AAPL ABT AMZN CAT CCE EXC GE JNJ MSFT PCG STT T VZ XOM ALCOA INC APPLE INC ABBOTT LABORATORIES AMAZON.COM INC CITIGROUP INC CATERPILLAR INC COCA-COLA ENTERPRISES INC EXELON CORP GENERAL ELECTRIC CO JOHNSON & JOHNSON MICROSOFT CORP PG&E CORP STATE STREET CORP AT&T INC VERIZON COMMUNICATIONS INC EXXON MOBIL CORP Alpha -0.801% 0.026% 0.047% 1.276% -0.045% -0.623% 0.275% -0.370% 0.366% 0.007% 0.317% 0.326% -0.155% 0.004% -0.106% -0.307% Beta 1.46 1.41 0.88 0.86 1.13 1.44 0.65 0.53 1.11 0.70 1.39 0.33 1.35 0.68 0.82 1.23 R 32.78% 54.74% 50.06% 14.01% 53.76% 59.11% 22.21% 12.15% 45.03% 55.46% 47.51% 5.90% 61.58% 39.39% 43.89% 56.76% Idiosyncratic Volatility 4.13% 2.54% 1.74% 4.23% 2.07% 2.36% 2.39% 2.80% 2.42% 1.24% 2.89% 2.63% 2.10% 1.68% 1.82% 2.11% Total Volatility 5.04% 3.77% 2.46% 4.56% 3.05% 3.70% 2.71% 2.99% 3.26% 1.85% 3.98% 2.71% 3.39% 2.15% 2.43% 3.22%
Step by Step Solution
There are 3 Steps involved in it
Step: 1
Based on the provided data here are the values for the CAPM beta coefficient and R2 for the listed companies Ticker AA Company ALCOA INC Beta 146 R2 3...
See step-by-step solutions with expert insights and AI powered tools for academic success
Step: 2

Step: 3

Ace Your Homework with AI
Get the answers you need in no time with our AI-driven, step-by-step assistance
Get Started


