

Answered step by step
Verified Expert Solution
Question
1 Approved Answer
Understanding the IS Curve What the IS curve tells us: Numerical example C=$1.4 trillion. = $1.2 trillion G= $3.0 trillion T=$3.0 trillion NX =$1.3 trillion.
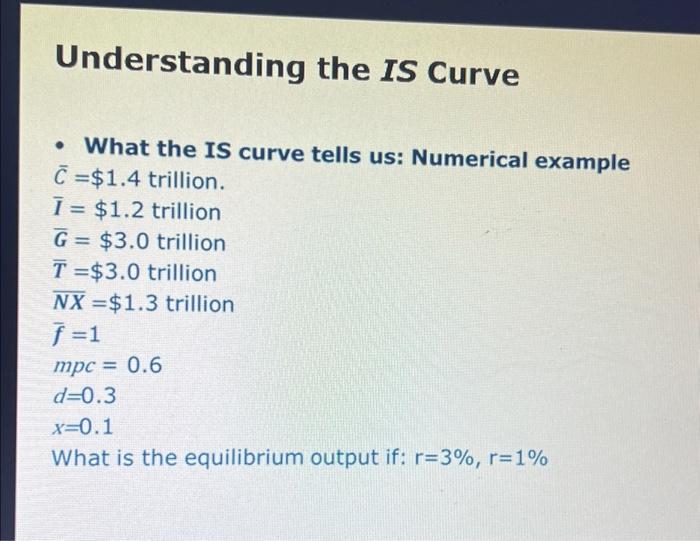
Understanding the IS Curve What the IS curve tells us: Numerical example C=$1.4 trillion. = $1.2 trillion G= $3.0 trillion T=$3.0 trillion NX =$1.3 trillion. f=1 mpc = 0.6 d=0.3 x=0.1 What is the equilibrium output if: r=3%, r=1%
Step by Step Solution
There are 3 Steps involved in it
Step: 1

Get Instant Access to Expert-Tailored Solutions
See step-by-step solutions with expert insights and AI powered tools for academic success
Step: 2

Step: 3
Ace Your Homework with AI
Get the answers you need in no time with our AI-driven, step-by-step assistance
Get Started
Finance Applications And Theory
Authors: Marcia Cornett, Troy Adair, John Nofsinger
6th Edition
1264101589, 9781264101580