Answered step by step
Verified Expert Solution
Link Copied!

Question

1 Approved Answer

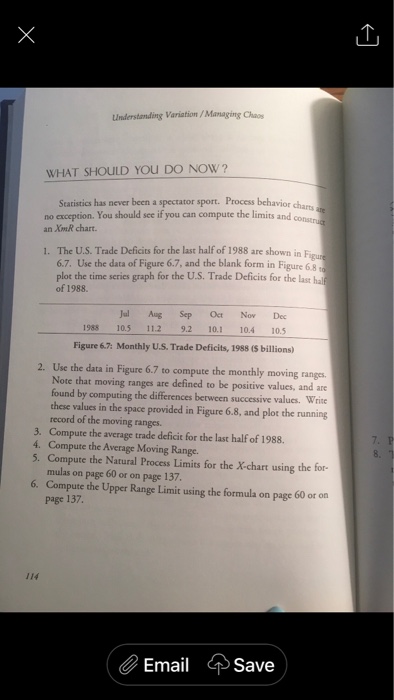
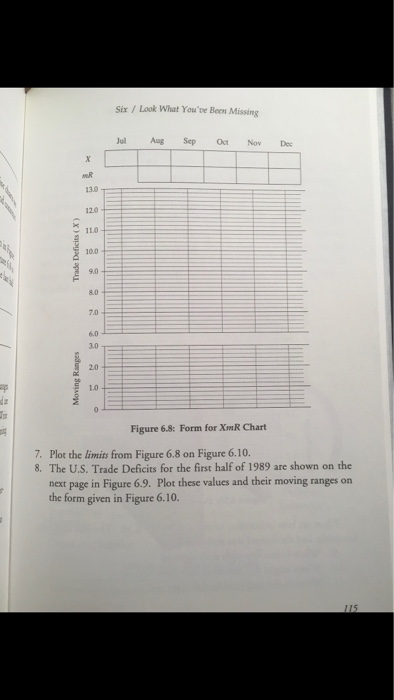
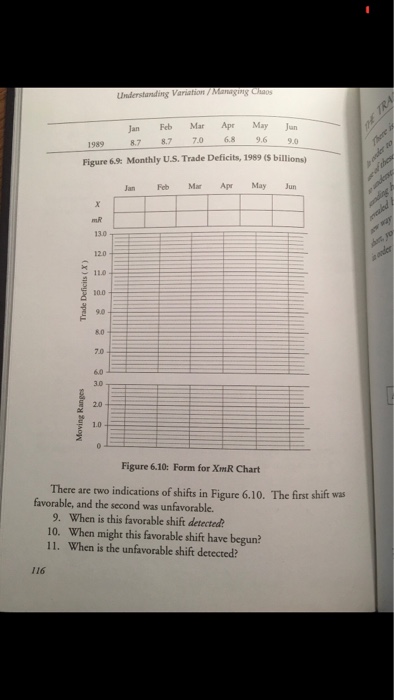
Understanding Variation/Managing Chaos Compute Average Moving Range, Natural Process Limits,Upper Range Limit Please help with ONLY questions 9 and 10. I believe that the answer

Understanding Variation/Managing Chaos

Compute Average Moving Range, Natural Process Limits,Upper Range Limit

Please help with ONLY questions 9 and 10. I believe that the answer can either be that the favorable shift begins during April when the negative trend slows down dramatically OR in May when it begins a steep positive trend. Thanks! Please explain to me how this is an honor code violation?
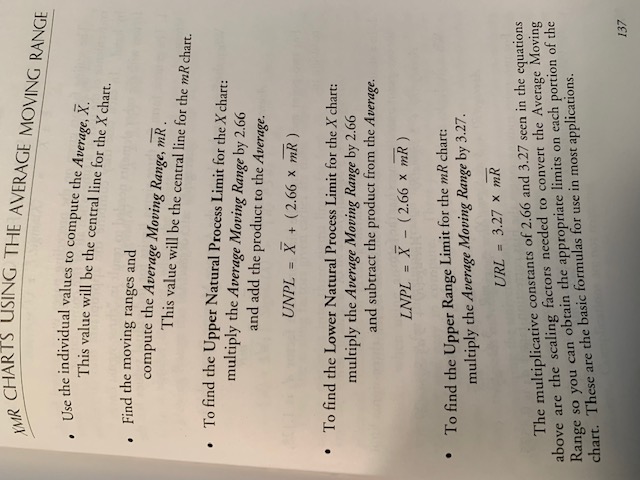
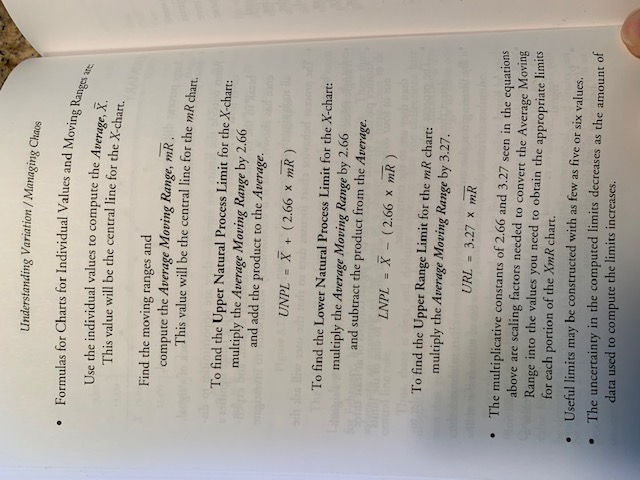
image text in transcribedimage text in transcribedimage text in transcribedimage text in transcribedimage text in transcribed
YMR CHARTS USING THE AVERAGE MOVING RANGE . Use the individual values to compute the Average, X. This value will be the central line for the X chart. . Find the moving ranges and compute the Average Moving Range, mR . This value will be the central line for the mR chart. . To find the Upper Natural Process Limit for the X chart: multiply the Average Moving Range by 2.66 and add the product to the Average. UNPL = X + (2.66 x mR ) . To find the Lower Natural Process Limit for the X chart: multiply the Average Moving Range by 2.66 and subtract the product from the Average. LNPL = X - (2.66 x mR ) . To find the Upper Range Limit for the mR chart: multiply the Average Moving Range by 3.27. URL = 3.27 X mR The multiplicative constants of 2.66 and 3.27 seen in the equations above are the scaling factors needed to convert the Average Moving Range so you can obtain the appropriate limits on each portion of the chart. These are the basic formulas for use in most applications. 137Understanding Variation / Managing Chaos " Formulas for Charts for Individual Values and Moving Ranges are Use the individual values to compute the Average, X. This value will be the central line for the X-chart. Find the moving ranges and compute the Average Moving Range, MR . This value will be the central line for the mR chart. To find the Upper Natural Process Limit for the X-chart: multiply the Average Moving Range by 2.66 and add the product to the Average. weed cons UNPL = X + (2.66 x mR ) To find the Lower Natural Process Limit for the X-chart: multiply the Average Moving Range by 2.66 and subtract the product from the Average. LNPL = X - (2.66 * mR ) To find the Upper Range Limit for the mR chart: multiply the Average Moving Range by 3.27. URL = 3.27 x mR . The multiplicative constants of 2.66 and 3.27 seen in the equations above are scaling factors needed to convert the Average Moving Range into the values you need to obtain the appropriate limits for each portion of the XR chart. Useful limits may be constructed with as few as five or six values. . The uncertainty in the computed limits decreases as the amount of data used to compute the limits increases.\f\f\f

Step by Step Solution

There are 3 Steps involved in it

Step: 1

blur-text-image

Get Instant Access to Expert-Tailored Solutions

See step-by-step solutions with expert insights and AI powered tools for academic success

Step: 2

blur-text-image_2

Step: 3

blur-text-image_3

Ace Your Homework with AI

Get the answers you need in no time with our AI-driven, step-by-step assistance

Get Started

Recommended Textbook for

Essentials of Business Analytics

Authors: Jeffrey D. Camm, James J. Cochran, Michael J. Fry, Jeffrey W. Ohlmann, David R. Anderson

2nd edition

1305627733, 978-1305861817, 1305861817, 978-0357688960, 978-1305627734

More Books

Students also viewed these Mathematics questions