Answered step by step
Verified Expert Solution
Question
1 Approved Answer
Unemployment rate: College v. High School Grads Year College High School 1999 2.8 5.9 2000 2.2 4.9 2001 2.2 1.8 2002 1.7 5.4 2003 2.3
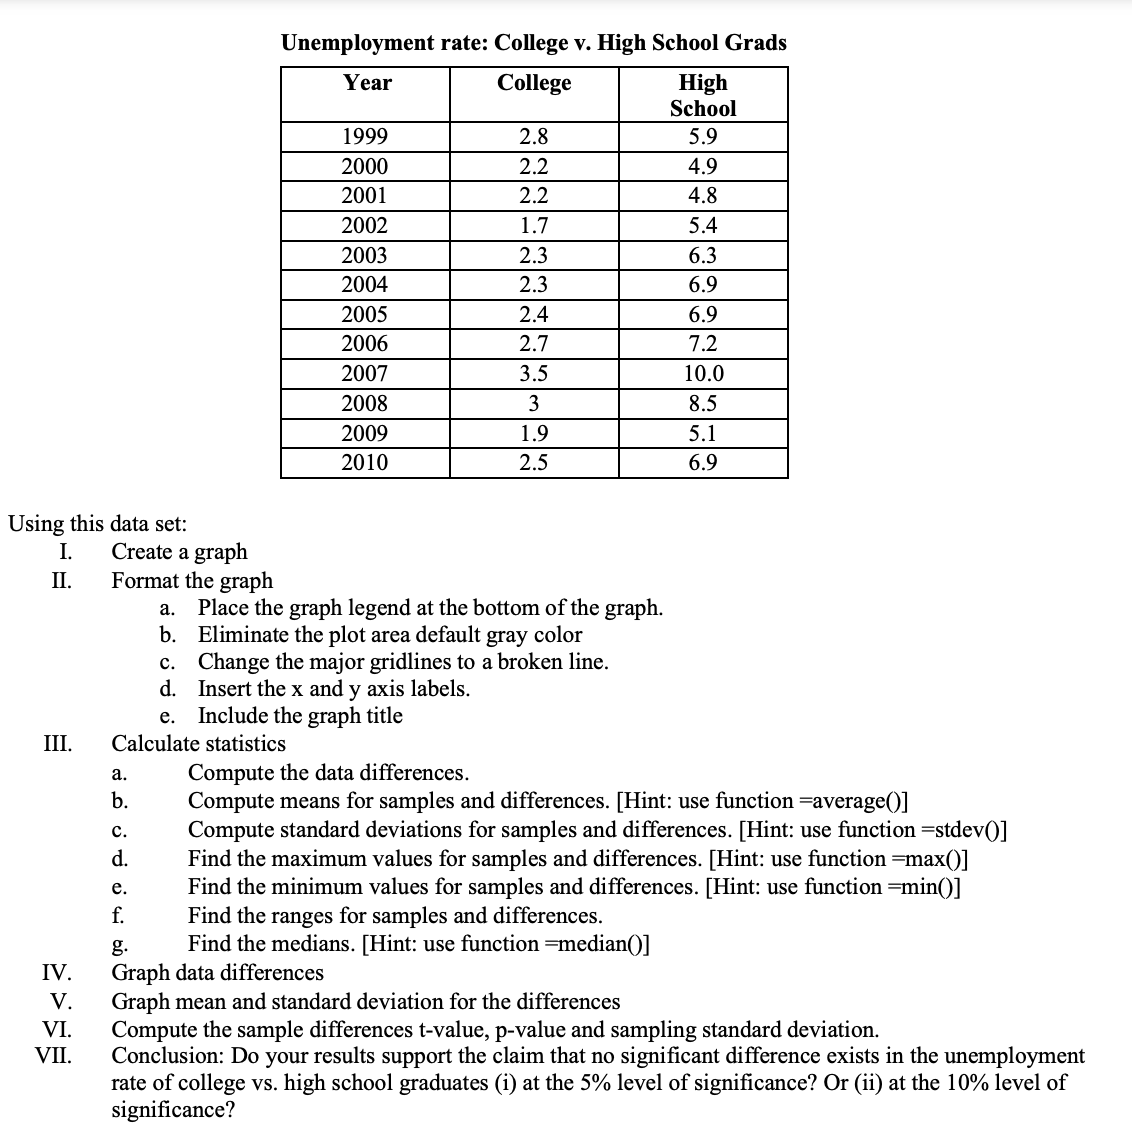
Unemployment rate: College v. High School Grads Year College High School 1999 2.8 5.9 2000 2.2 4.9 2001 2.2 1.8 2002 1.7 5.4 2003 2.3 5.3 2004 2.3 6.9 2005 2.4 5.9 2006 2.7 7.2 2007 3.5 10.0 2008 3 8.5 2009 1.9 5.1 2010 2.5 6.9 Using this data set: 1. Create a graph II. Format the graph a. Place the graph legend at the bottom of the graph. b. Eliminate the plot area default gray color C. Change the major gridlines to a broken line. d. Insert the x and y axis labels. e. Include the graph title III. Calculate statistics a. Compute the data differences. Compute means for samples and differences. [Hint: use function =average()] Compute standard deviations for samples and differences. [Hint: use function =stdev()] Find the maximum values for samples and differences. [Hint: use function =max()] Find the minimum values for samples and differences. [Hint: use function =min()] Find the ranges for samples and differences. Find the medians. [Hint: use function =median()] IV. Graph data differences V. Graph mean and standard deviation for the differences VI. Compute the sample differences t-value, p-value and sampling standard deviation. VII. Conclusion: Do your results support the claim that no significant difference exists in the unemployment rate of college vs. high school graduates (i) at the 5% level of significance? Or (ii) at the 10% level of significance
Step by Step Solution
There are 3 Steps involved in it
Step: 1
Get Instant Access to Expert-Tailored Solutions
See step-by-step solutions with expert insights and AI powered tools for academic success
Step: 2
Step: 3
Ace Your Homework with AI
Get the answers you need in no time with our AI-driven, step-by-step assistance
Get Started