Answered step by step
Verified Expert Solution
Question
1 Approved Answer
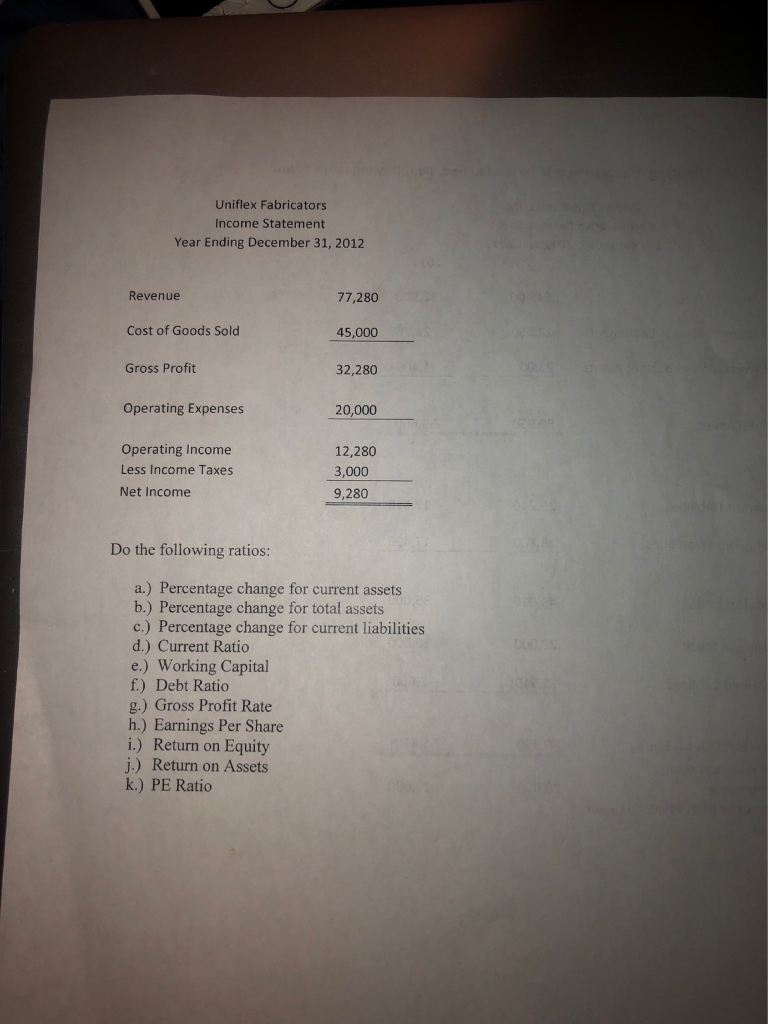
Uniflex Fabricators Income Statement Year Ending December 31, 2012 Revenue Cost of Goods Sold Gross Profit 77,280 45,000 32,280 20,000 Operating Expenses Operating Income Less


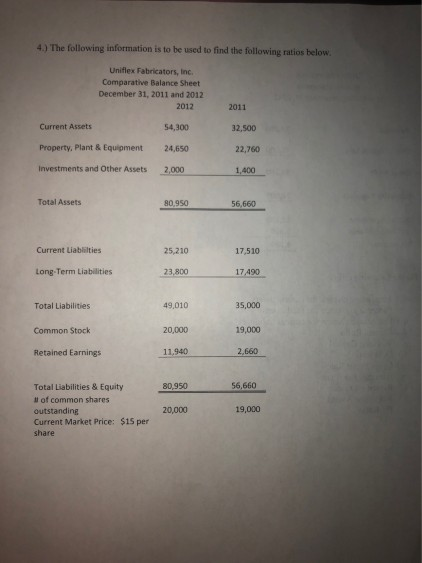
Uniflex Fabricators Income Statement Year Ending December 31, 2012 Revenue Cost of Goods Sold Gross Profit 77,280 45,000 32,280 20,000 Operating Expenses Operating Income Less Income Taxes Net Income 12,280 3,000 9,280 Do the following ratios: a.) Percentage change for current assets b.) Percentage change for total assets c.) Percentage change for current liabilities d.) Current Ratio e.) Working Capital f.) Debt Ratio g.) Gross Profit Rate h.) Earnings Per Share i.) Return on Equity j.) Return on Assets k.) PE Ratio 4) The following information is to be used to find the following ratios below Uniflex Fabricators, Inc. Comparatve Balance Sheet December 31, 2011 and 2012 2012 54,300 24,650 2,000 2011 Current Assets Property, Plant & Equipment Investments and Other Assets 32,500 22,760 1,400 Total Assets 80.,950 Current Liablilties 25,210 17,510 Long-Term Liabilities 23,800 17.490 49,010 20,000 11,940 35,000 Total Liabilities Common Stock Retained Earnings 19,000 2,660 56,660 Total Liabilities & Equity l of common shares outstanding Current Market Price: $15 per share 80,950 20,000 19,000
Step by Step Solution
There are 3 Steps involved in it
Step: 1

Get Instant Access to Expert-Tailored Solutions
See step-by-step solutions with expert insights and AI powered tools for academic success
Step: 2

Step: 3

Ace Your Homework with AI
Get the answers you need in no time with our AI-driven, step-by-step assistance
Get Started


