Answered step by step
Verified Expert Solution
Link Copied!

Question

1 Approved Answer

Unit 3 Discussion - Which is Best: Mean or Median? Instructions This week you will use the Bureau of Labor Statistics website to search for

Unit 3 Discussion - Which is Best: Mean or Median?

Instructions

This week you will use the Bureau of Labor Statistics website to search for income data on the occupation you are seeking.Visit the following

website:https://www.bls.gov/bls/blswage.htm(Links to an external site.)

The BLS has wage information for hundreds of jobs and data can also be found by state. There is much information here so take some time to browse around.

Once you arrive at the site, complete the following steps to gather the data you need to answer the discussion questions.
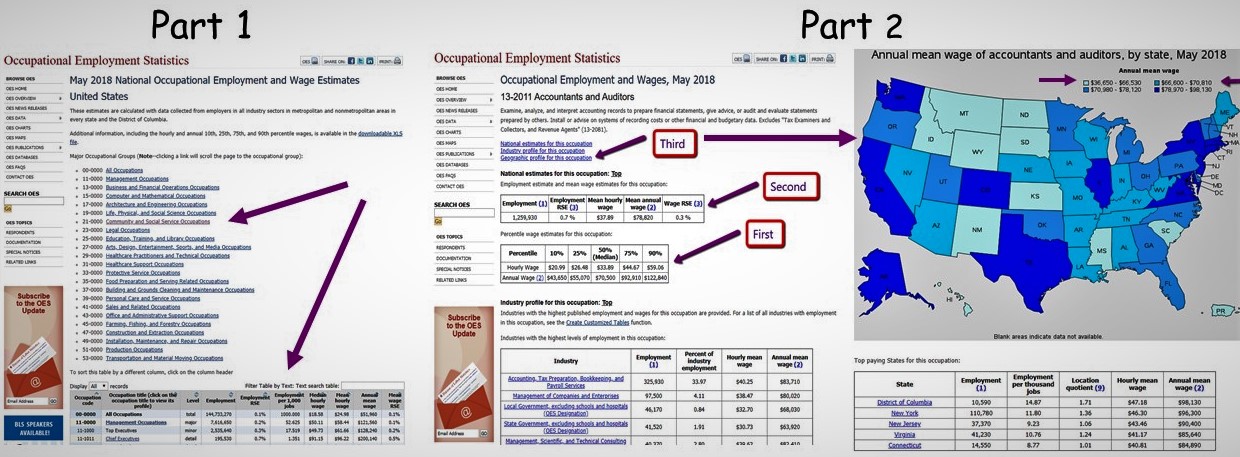
Part 1

  • Search for information on your occupation by clicking on national wage data 800 occupations. This will take you to the Occupational Employment Statistics page.
  • Scroll to the bottom of that page for a table listing the major and sub-job categories. Note in the first column there is an occupation code. For example, accountants and auditors have the code 13-2011 and are listed under banking and financial operations.
  • Click on the job title to find earnings information. There you will find mean wages as well as percentiles and the 5-number summary.
  • Compare the mean and median pays. For example, the mean pay for accountants was $78,800 and the median was $70,500.
  • Record the information on percentiles, the 5-number summary, the mean, and the median.

Part 2

  • Above the data on the occupation page, you will find the following links:
  • National estimates for this occupation
  • Industry profile for this occupation
  • Geographic profile for this occupation.
  • Select the geographic profile to view maps of the states.
  • Scroll down to the map that presents mean wages by state using the color code.
  • Compare the ranges of wages of the states based on the ranges presented.
  • Identify the highest paying and lowest paying states.

image text in transcribed
Part 1 Part 2 Occupational Employment Statistics Occupational Employment Statistics Annual mean wage of accountants and auditors, by state, May 2018 Annual mean wage May 2018 National Occupational Employment and Wage Estimates ADAM DES Occupational Employment and Wages, May 2018 134,150 - 436,530 466,800 - 170.810 170,980 - $78 120 United States 578 570 - 958.135 13-2011 Accountants and Auditors His are calculated wait dian of Examine, analyor, and interpret accounting records to prepare financial statements, glow advice, or audit and evaluate statements every state and the District of Columbia prepared by other Inical or advipe on probers of recording casts or other financial and budgetary drta. Exdudes Tax Examiners and meal itch. Bach rach, and with percentile addable MS Collectors, and Revenue Agents" (13-3081) Third Higer Occupational Groups (Note-clicking a link will scroll the page to the occupational group) CIS PUBLICATIONS PA ML CONTACT DEF National estimates for this occupation: Jog OH LIT IN il Couations Convertion CONTACT ON int estimate and mean wipe estimates for this occupations Second SEARCH DES K'S mint and Eppintering Creations SEARCH OUS Employment Mean hourly Hean annual ROSE (3) wage (2) Wage RSE (3) KY wage OIN TOPICS 03% TIM NO matoit ,and Social Senoot Obamacats Peromble mage estimates for this occupation: First SC CA 10 25% 75% MS Annual Wage (20 $43,650 $35,020 576,503 562 410 $122,840 Subscribe to the OES Industry profile for this occupation: Top H Update Subscribe Industries with the highart published + playment and mights for this occupation are provided. For a list of all indurban with employment LPR to the DES in this occupation Update Subdon't with the highest Steels of employment in thit occupuses Blink wears indicate data not available. troend of Industry Induity Hourly mean Annual mean Top paying States for this occupation: To sort this table by a different column, click on the column header We Table by Text: Test search table: $40.25 Imployment State Employment per thousand Location Hourly mean Annual mean quotient (!] wage wage (2) 17.500 411 District of Columba 10,590 14,87 1.71 $47.18 $95,130 All Gory 14. 170 110.703 11.80 1.36 $46.30 $96,700 BLS SPEAKERS 41.520 1.#1 37,370 1.23 1.06 $43.46 590,400 AVAILABLE! 41,230 10.76 1.24 $41.17 485,640 ora din 14.530 4.77 1.08 $40.81 584.690

Step by Step Solution

There are 3 Steps involved in it

Step: 1

blur-text-image

Get Instant Access to Expert-Tailored Solutions

See step-by-step solutions with expert insights and AI powered tools for academic success

Step: 2

blur-text-image

Step: 3

blur-text-image

Ace Your Homework with AI

Get the answers you need in no time with our AI-driven, step-by-step assistance

Get Started

Recommended Textbook for

College Algebra

Authors: Michael Sullivan

9th Edition

0321830725, 9780321830722

More Books

Students also viewed these Mathematics questions