

Question
Universal Electronics is considering the purchase of manufacturing equipment with a 10-year midpoint in its asset depreciation range (ADR). Carefully refer to Table 1211 to
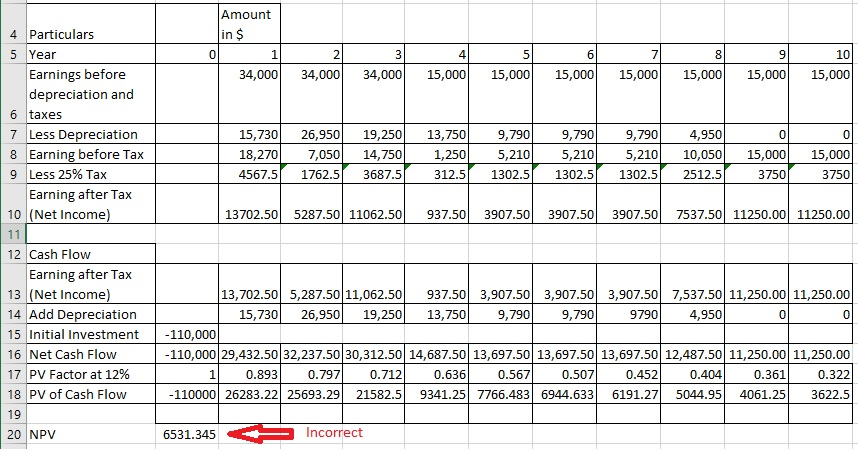
Universal Electronics is considering the purchase of manufacturing equipment with a 10-year midpoint in its asset depreciation range (ADR). Carefully refer to Table 1211 to determine in what depreciation category the asset falls. (Hint: It is not 10 years.) The asset will cost $110,000, and it will produce earnings before depreciation and taxes of $34,000 per year for three years, and then $15,000 a year for seven more years. The firm has a tax rate of 25 percent. Assume the cost of capital is 12 percent. In doing your analysis, if you have years in which there is no depreciation, merely enter a zero for depreciation. Use Table 1212. Use Appendix B for an approximate answer but calculate your final answer using the formula and financial calculator methods.
a. Calculate the net present value. (Do not round intermediate calculations and round your answer to 2 decimal places.) 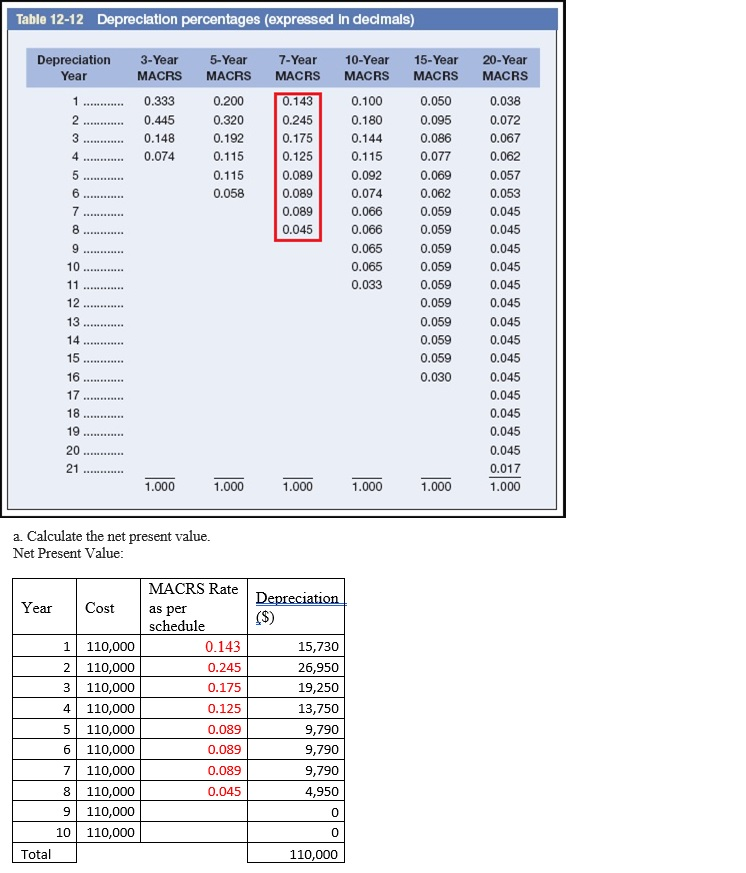
Please resolve this issue
Table 12-12 Depreciation percentages (expressed in decimals) Depreciation Year 1. 2 3 3-Year MACRS 0.333 0.445 0.148 0.074 5-Year MACRS 0.200 0.320 0.192 0.115 0.115 0.058 7-Year MACRS 0.143 0.245 0.175 0.125 0.089 0.089 0.089 0.045 4 5 10-Year MACRS 0.100 0.180 0.144 0.115 0.092 0.074 0.066 0.066 0.065 0.065 0.033 6 7 15-Year MACRS 0.050 0.095 0.086 0.077 0.069 0.062 0.059 0.059 0.059 0.059 0.059 0.059 0.059 0.059 0.059 0.030 8 . 9 10 11 12 20-Year MACRS 0.038 0.072 0.067 0.062 0.057 0.053 0.045 0.045 0.045 0.045 0.045 0.045 0.045 0.045 0.045 0.045 0.045 0.045 0.045 0.045 0.017 1.000 13 HERRE 14 15 16 17 ER 18 19 20 21 1.000 1.000 1.000 1.000 1.000 a Calculate the net present value. Net Present Value: Year Cost Depreciation ($) MACRS Rate as per schedule 0.143 0.245 0.175 0.125 0.089 1 110,000 2 110,000 3 110,000 4 110,000 5 110,000 6 110,000 7 110,000 8 110,000 9 110,000 10 110,000 15,730 26,950 19,250 13,750 9,790 9,790 9,790 4,950 0 0.089 0.089 0.045 0 Total 110,000 Amount in $ 1 34,000 0 2 4 5 6 7 8 9 10 3 34,000 34,000 15,000 15,000 15,000 15,000 15,000 15,000 15,000 0 0 15,730 18,270 4567.5 26,950 7,050 19,250 14,750 3687.5 13,750 1,250 312.5 9,790 5,210 1302.5 9,790 5,210 1302.5 9,790 5,210 1302.5 4,950 10,050 2512.51 15,000 37501 15,000 3750 1762.5 13702.50 5287.50 11062.50 937.50 3907.50 3907.50 3907.50 7537.50 11250.00 11250.00 4 Particulars 5 Year Earnings before depreciation and 6 taxes 7 Less Depreciation 8 Earning before Tax 9 Less 25% Tax Earning after Tax 10 (Net Income) 11 12 Cash Flow Earning after Tax 13 (Net Income) 14 Add Depreciation 15 Initial Investment 16 Net Cash Flow 17 PV Factor at 12% 18 PV of Cash Flow 19 13,702.50 5,287.50 11,062.50 937.50 3,907.50 3,907.50 3,907.50 7,537.50 11,250.00 11,250.00 15,730 26,950 19,250 13,750 9,790 9,790 9790 4,950 0 0 -110,000 -110,000 29,432.50 32,237.50 30,312.50 14,687.50 13,697.50 13,697.50 13,697.50 12,487.50 11,250.00 11,250.00 1 0.893 0.797 0.712 0.636 0.567 0.507 0.452 0.404 0.361 0.322 -110000 26283.22 25693.29 21582.5 9341.25 7766.483 6944.633 6191.27 5044.95 4061.25 3622.5 20 NPV 6531.345 IncorrectStep by Step Solution
There are 3 Steps involved in it
Step: 1

Get Instant Access to Expert-Tailored Solutions
See step-by-step solutions with expert insights and AI powered tools for academic success
Step: 2

Step: 3
Ace Your Homework with AI
Get the answers you need in no time with our AI-driven, step-by-step assistance
Get Started
Finance And Sustainability
Authors: Karolina Daszyńska-Żygadło, Agnieszka Bem, Bożena Ryszawska, Erika Jáki, Taťána Hajdíková
1st Edition
3030344037, 978-3030344030