

Question
University club is deciding based on their balance sheet and income statement to 1) increase membership fee of $10 and above, 2)increase members by making
University club is deciding based on their balance sheet and income statement to 1) increase membership fee of $10 and above, 2)increase members by making employee joining the club as mandatory option but union permission is required and university is hesitant to approach union, or 3) close the club.
Please show the analytics of all financial ratios and calculate and interpret financial ratios as analytical tools for decision-making. Using both quantitative and qualitative information, what should the board do?
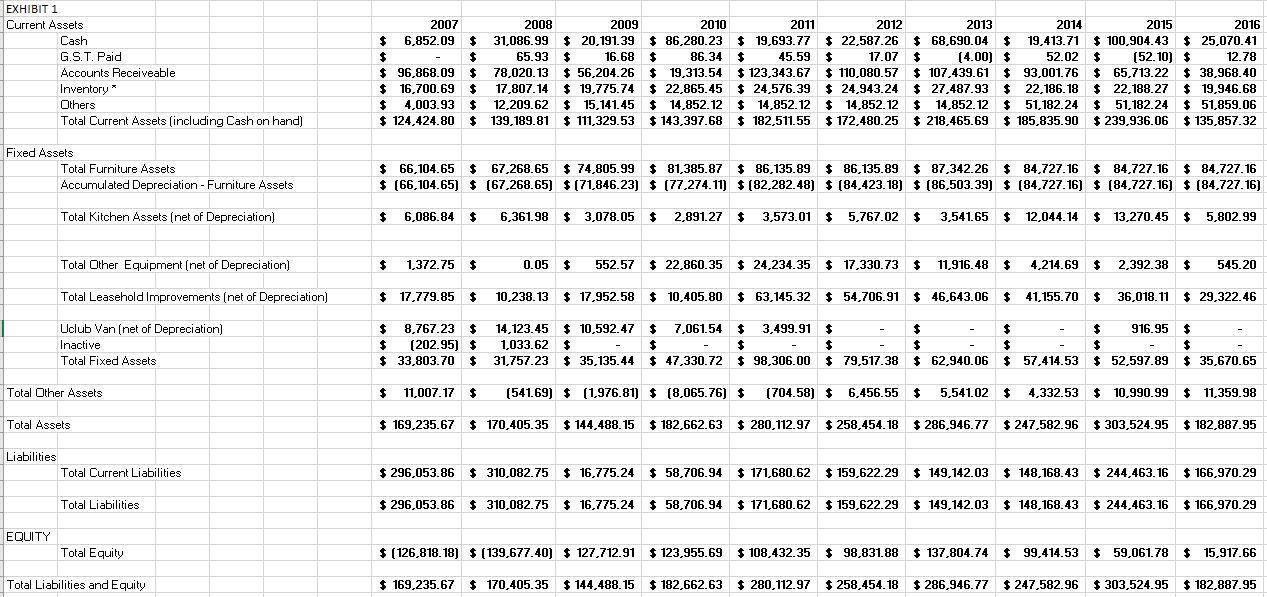
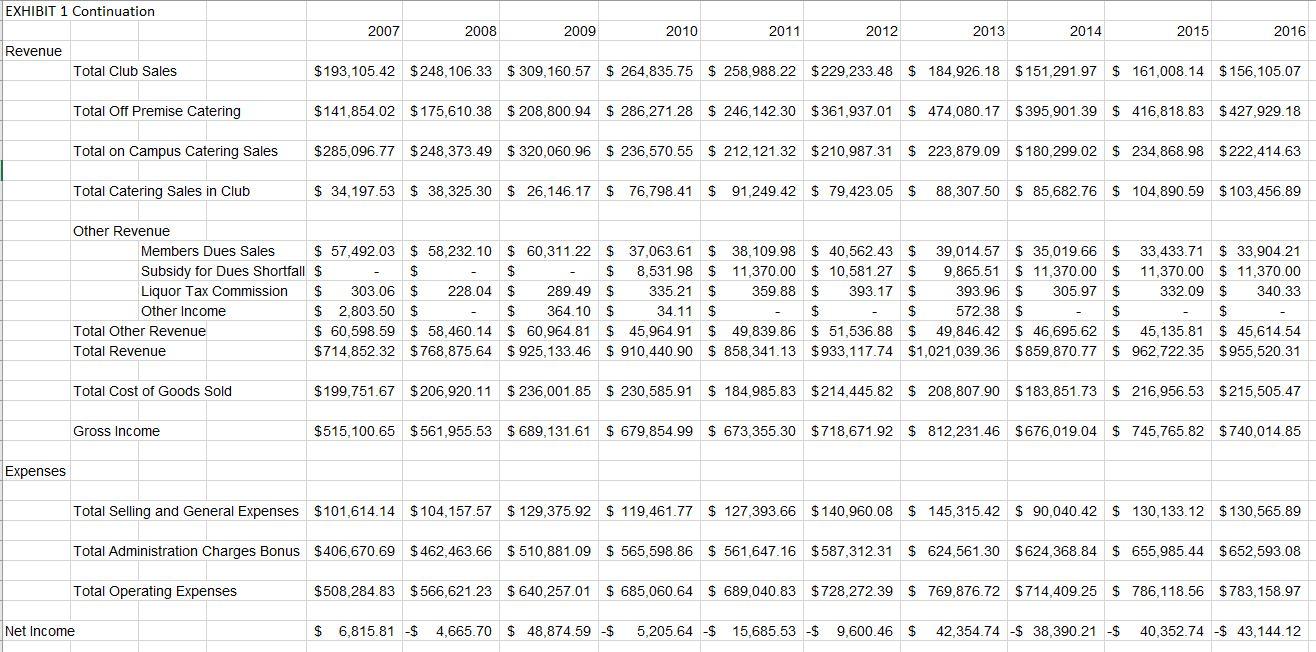
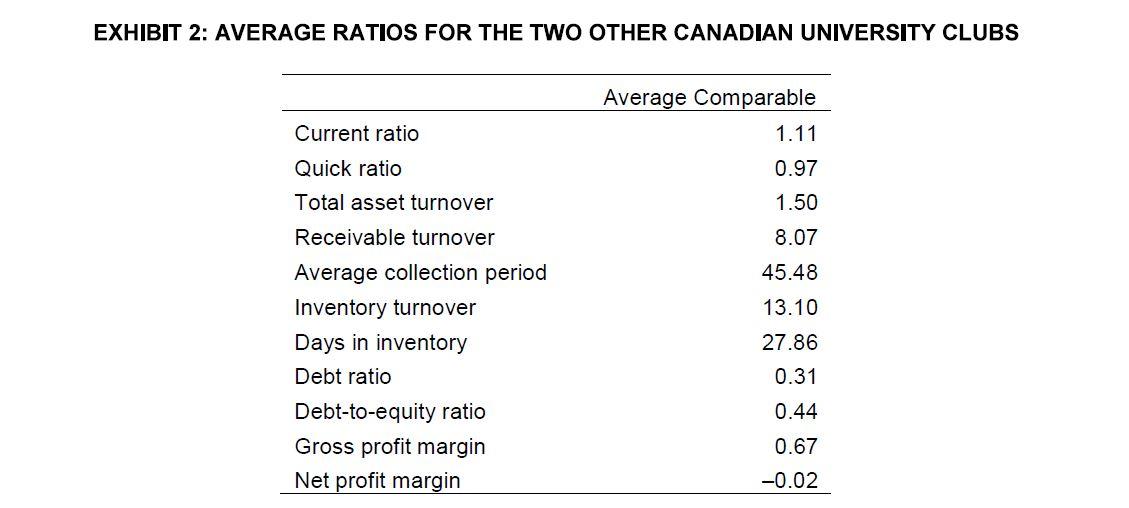
16.68 EXHIBIT 1 Current Assets Cash G.S.T. Paid Accounts Receiveable Inventory * Others Total Current Assets (including Cash on hand) 2007 2008 2009 2010 2011 2012 2013 2014 2015 2016 $ 6,852.09 $ 31,086.99 $ 20,191.39 $ 86,280.23 $ 19,693.77 $ 22,587.26 $ 68,690.04 $ 19,413.71 $100,904.43 $ 25,070.41 $ $ 65.93 $ $ 86.34 $ 45.59 $ 17.07 $ (4.00) $ 52.02 $ (52.10) $ 12.78 $ 96,868.09 $ 78,020.13 $ 56,204.26 $ 19,313.54 123,343.67 $ 110,080.57 $ 107,439.61 $ 93,001.76 $ 65,713.22 $ 38,968.40 $ 16,700.69 $ 17,807.14 $19,775.74 $ 22,865.45 $ 24,576.39 $ 24,576.39 $ 24,943.24 $ 27,487.93 $ 22,186.18 $ 22,188.27 $ 19,946.68 $ 4.003.93 $ 12,209.62 $ 15,141.45 $ 14,852. 12 $14,852.12 $14,852.12 $14,852.12 $ 14,852.12 $ 51,182.24 $ 51,182.24 $ 51,859.06 $ 124,424.80 $ 139,189.81 $ 111,329.53 $ 143,397.68 $ 182,511.55 172,480.25 $ 218,465.69 $ 185,835.90 $ 239,936.06 $ 135,857.32 Fixed Assets Total Furniture Assets Accumulated Depreciation - Furniture Assets $ 66,104.65 $ 67,268.65 $ 74,805.99 $ 81,385.87 $ 86,135.89 $86,135.89 87,342.26 $ 84,727.16 $ 84,727.16 $ 84,727.16 $ (66,104.65) $ (67,268.65) $ (71,846.23) $ (77,274.11) $ (82,282.48) $ (84,423.18) $ (86,503.39) $ (84,727.16) $ (84,727.16) $ (84,727.16) Total Kitchen Assets (net of Depreciation) $ 6,086.84 $ 6,361.98 $ 3,078.05 $ 2,891.27 $ 3,573.01 $ 5,767.02 $ 3,541.65 $ 12,044.14 $13,270.45 $ 5,802.99 Total Other Equipment (net of Depreciation) $ 1,372.75 $ 0.05 $ 552.57 $ 22,860.35 $ 24,234.35 $17,330.73 $ 11,916.48 $ 4,214.69 $ 2,392.38 $ 545.20 Total Leasehold Improvements (net of Depreciation) $ 17,779.85 $ 10,238.13 $17,952.58 $ 10,405.80 $63,145.32 $ 54,706.91 $ 46,643.06 $ 41,155.70 $ 36,018.11 $ 29,322.46 Uclub Van (net of Depreciation) Inactive Total Fixed Assets $ 8,767.23 $ $ (202.95) $ $ 33,803.70 $ 14,123.45 $ 10,592.47 $ 7,061.54 $ 3,499.91 $ $ $ $ 916.95 $ 1,033.62 $ $ $ $ $ $ $ $ 31,757.23 $ 35,135.44 $ 47,330.72 $ 98,306.00 $ 79,517.38 $ 62,940.06 $ 57,414.53 $ 52,597.89 $ 35,670.65 Total Other Assets $ 11,007.17 $ (541.69) $ (1,976.81) $ (8,065.76) $ (704.58) $ 6,456.55 $ 5,541.02 $ 4,332.53 $ 10,990.99 $ 11,359.98 Total Assets $ 169,235.67 $ 170,405.35 $144,488.15 182,662.63 $ 280,112.97 $ 258,454.18 $286,946.77 $ 247,582.96 $ 303,524.95 $182,887.95 Liabilities Total Current Liabilities $ 296,053.86 $ 310,082.75 $ 16,775.24 58,706.94 $ 171,680.62 $ 159,622.29 $ 149, 142.03 $ 148,168.43 $ 244,463.16 $ 166,970.29 Total Liabilities $ 296,053.86 $ 310,082.75 $ 16,775.24 $ 58,706.94 $ 171,680.62 $ 159,622.29 $ 149,142.03 $ 148, 168.43 $ 244,463.16 $ 166,970.29 EQUITY Total Equity $(126,818.18) $ (139,677.40) $ 127,712.91 $123,955.69 $ 123,955.69 $ 108,432.35 $ 98,831.88 $ 137,804.74 $ 99,414.53 $ 59,061.78 $ 15,917.66 Total Liabilities and Equity $ 169,235.67 $ 170,405.35 $144,488.15 S 182,662.63 $ 280,112.97 $ 258,454. 18 $ 258,454.18 $286,946.77 $ 247,582.96 $ 303,524.95 $ 182,887.95 EXHIBIT 1 Continuation 2007 2008 2009 2010 2011 2012 2013 2014 2015 2016 Revenue Total Club Sales $ 193,105.42 $ 248,106.33 $ 309,160.57 $ 264.835.75 $ 258,988.22 $ 229,233.48 $ 184,926.18 $ 151,291.97 $ 161,008.14 $156,105.07 Total Off Premise Catering $141,854.02 $ 175,610.38 $ 208,800.94 $ 286,271.28 $ 246,142.30 $361,937.01 $ 474,080.17 $395,901.39 $ 416,818.83 $427,929.18 Total on Campus Catering Sales $285,096.77 $ 248,373.49 $ 320,060.96 $ 236,570.55 $ 212,121.32 $ 210,987.31 $ 223,879.09 $ 180,299.02 $ 234,868.98 $ 222,414.63 Total Catering Sales in Club $ 34,197.53 $ 38,325.30 $ 26,146.17 $ 76,798.41 $ 91,249.42 $ 79,423.05 $ 88,307.50 $ 85,682.76 $ 104,890.59 $ 103,456.89 Other Revenue Members Dues Sales $ 57,492.03 $ 58,232.10 $ 60,311.22 $ 37,063.61 $ 38,109.98 $ 40,562.43 $ 39,014.57 $ 35,019.66 $ 33,433.71 $ 33,904.21 Subsidy for Dues Shortfall $ $ $ $ 8,531.98 $ 11,370.00 $ 10,581.27 $ 9,865.51 $ 11,370.00 $ 11,370.00 $ 11,370.00 Liquor Tax Commission $ 303.06 $ 228.04 $ 289.49 $ 335.21 $ 359.88 $ 393.17 $ 393.96 $ 305.97 $ 332.09 $ 340.33 Other Income $ 2.803.50 $ $ 364.10 $ 34.11 $ $ $ 572.38 $ $ $ Total Other Revenue $ 60,598.59 $ 58,460.14 $ 60,964.81 $ 45,964.91 $ 49,839.86 $ 51,536.88 $ 49,846.42 $ 46,695.62 $ 45,135.81 $ 45,614.54 Total Revenue $714,852.32 $ 768,875.64 $925,133.46 $ 910,440.90 $ 858,341.13 $933,117.74 $1,021,039.36 $ 859,870.77 $ 962,722.35 $955,520.31 Total Cost of Goods Sold $199,751.67 $206,920.11 $ 236,001.85 $ 230,585.91 $ 184,985.83 $ 214,445.82 $ 208,807.90 $ 183,851.73 $ 216,956.53 $215,505.47 Gross Income $515,100.65 $561,955.53 $ 689,131.61 $ 679,854.99 $ 673,355.30 $ 718,671.92 $ 812,231.46 $676,019.04 $ 745,765.82 $ 740,014.85 Expenses Total Selling and General Expenses $ 101,614.14 $104,157.57 $ 129,375.92 $ 119,461.77 $ 127,393.66 $ 140,960.08 $ 145,315.42 $ 90,040.42 $ 130,133.12 $130,565.89 Total Administration Charges Bonus $406,670.69 $ 462,463.66 $ 510,881.09 $ 565,598.86 $ 561,647.16 $587,312.31 $ 624,561.30 $624,368.84 $ 655,985.44 $652,593.08 Total Operating Expenses $508,284.83 $566,621.23 $ 640,257 01 $ 685,060.64 $ 689,040.83 $728,272.39 $ 769,876.72 $714,409.25 $ 786,118.56 $783,158.97 Net Income $ 6,815.81 $ 4,665.70 $ 48,874.59 $ 5,205.64 -$ 15,685.53 -$ 9,600.46 $ 42,354.74 $ 38,390.21 -$ 40,352.74 $ 43, 144.12 EXHIBIT 2: AVERAGE RATIOS FOR THE TWO OTHER CANADIAN UNIVERSITY CLUBS Average Comparable 1.11 Current ratio Quick ratio Total asset turnover 0.97 1.50 8.07 45.48 13.10 27.86 Receivable turnover Average collection period Inventory turnover Days in inventory Debt ratio Debt-to-equity ratio Gross profit margin Net profit margin 0.31 0.44 0.67 -0.02 16.68 EXHIBIT 1 Current Assets Cash G.S.T. Paid Accounts Receiveable Inventory * Others Total Current Assets (including Cash on hand) 2007 2008 2009 2010 2011 2012 2013 2014 2015 2016 $ 6,852.09 $ 31,086.99 $ 20,191.39 $ 86,280.23 $ 19,693.77 $ 22,587.26 $ 68,690.04 $ 19,413.71 $100,904.43 $ 25,070.41 $ $ 65.93 $ $ 86.34 $ 45.59 $ 17.07 $ (4.00) $ 52.02 $ (52.10) $ 12.78 $ 96,868.09 $ 78,020.13 $ 56,204.26 $ 19,313.54 123,343.67 $ 110,080.57 $ 107,439.61 $ 93,001.76 $ 65,713.22 $ 38,968.40 $ 16,700.69 $ 17,807.14 $19,775.74 $ 22,865.45 $ 24,576.39 $ 24,576.39 $ 24,943.24 $ 27,487.93 $ 22,186.18 $ 22,188.27 $ 19,946.68 $ 4.003.93 $ 12,209.62 $ 15,141.45 $ 14,852. 12 $14,852.12 $14,852.12 $14,852.12 $ 14,852.12 $ 51,182.24 $ 51,182.24 $ 51,859.06 $ 124,424.80 $ 139,189.81 $ 111,329.53 $ 143,397.68 $ 182,511.55 172,480.25 $ 218,465.69 $ 185,835.90 $ 239,936.06 $ 135,857.32 Fixed Assets Total Furniture Assets Accumulated Depreciation - Furniture Assets $ 66,104.65 $ 67,268.65 $ 74,805.99 $ 81,385.87 $ 86,135.89 $86,135.89 87,342.26 $ 84,727.16 $ 84,727.16 $ 84,727.16 $ (66,104.65) $ (67,268.65) $ (71,846.23) $ (77,274.11) $ (82,282.48) $ (84,423.18) $ (86,503.39) $ (84,727.16) $ (84,727.16) $ (84,727.16) Total Kitchen Assets (net of Depreciation) $ 6,086.84 $ 6,361.98 $ 3,078.05 $ 2,891.27 $ 3,573.01 $ 5,767.02 $ 3,541.65 $ 12,044.14 $13,270.45 $ 5,802.99 Total Other Equipment (net of Depreciation) $ 1,372.75 $ 0.05 $ 552.57 $ 22,860.35 $ 24,234.35 $17,330.73 $ 11,916.48 $ 4,214.69 $ 2,392.38 $ 545.20 Total Leasehold Improvements (net of Depreciation) $ 17,779.85 $ 10,238.13 $17,952.58 $ 10,405.80 $63,145.32 $ 54,706.91 $ 46,643.06 $ 41,155.70 $ 36,018.11 $ 29,322.46 Uclub Van (net of Depreciation) Inactive Total Fixed Assets $ 8,767.23 $ $ (202.95) $ $ 33,803.70 $ 14,123.45 $ 10,592.47 $ 7,061.54 $ 3,499.91 $ $ $ $ 916.95 $ 1,033.62 $ $ $ $ $ $ $ $ 31,757.23 $ 35,135.44 $ 47,330.72 $ 98,306.00 $ 79,517.38 $ 62,940.06 $ 57,414.53 $ 52,597.89 $ 35,670.65 Total Other Assets $ 11,007.17 $ (541.69) $ (1,976.81) $ (8,065.76) $ (704.58) $ 6,456.55 $ 5,541.02 $ 4,332.53 $ 10,990.99 $ 11,359.98 Total Assets $ 169,235.67 $ 170,405.35 $144,488.15 182,662.63 $ 280,112.97 $ 258,454.18 $286,946.77 $ 247,582.96 $ 303,524.95 $182,887.95 Liabilities Total Current Liabilities $ 296,053.86 $ 310,082.75 $ 16,775.24 58,706.94 $ 171,680.62 $ 159,622.29 $ 149, 142.03 $ 148,168.43 $ 244,463.16 $ 166,970.29 Total Liabilities $ 296,053.86 $ 310,082.75 $ 16,775.24 $ 58,706.94 $ 171,680.62 $ 159,622.29 $ 149,142.03 $ 148, 168.43 $ 244,463.16 $ 166,970.29 EQUITY Total Equity $(126,818.18) $ (139,677.40) $ 127,712.91 $123,955.69 $ 123,955.69 $ 108,432.35 $ 98,831.88 $ 137,804.74 $ 99,414.53 $ 59,061.78 $ 15,917.66 Total Liabilities and Equity $ 169,235.67 $ 170,405.35 $144,488.15 S 182,662.63 $ 280,112.97 $ 258,454. 18 $ 258,454.18 $286,946.77 $ 247,582.96 $ 303,524.95 $ 182,887.95 EXHIBIT 1 Continuation 2007 2008 2009 2010 2011 2012 2013 2014 2015 2016 Revenue Total Club Sales $ 193,105.42 $ 248,106.33 $ 309,160.57 $ 264.835.75 $ 258,988.22 $ 229,233.48 $ 184,926.18 $ 151,291.97 $ 161,008.14 $156,105.07 Total Off Premise Catering $141,854.02 $ 175,610.38 $ 208,800.94 $ 286,271.28 $ 246,142.30 $361,937.01 $ 474,080.17 $395,901.39 $ 416,818.83 $427,929.18 Total on Campus Catering Sales $285,096.77 $ 248,373.49 $ 320,060.96 $ 236,570.55 $ 212,121.32 $ 210,987.31 $ 223,879.09 $ 180,299.02 $ 234,868.98 $ 222,414.63 Total Catering Sales in Club $ 34,197.53 $ 38,325.30 $ 26,146.17 $ 76,798.41 $ 91,249.42 $ 79,423.05 $ 88,307.50 $ 85,682.76 $ 104,890.59 $ 103,456.89 Other Revenue Members Dues Sales $ 57,492.03 $ 58,232.10 $ 60,311.22 $ 37,063.61 $ 38,109.98 $ 40,562.43 $ 39,014.57 $ 35,019.66 $ 33,433.71 $ 33,904.21 Subsidy for Dues Shortfall $ $ $ $ 8,531.98 $ 11,370.00 $ 10,581.27 $ 9,865.51 $ 11,370.00 $ 11,370.00 $ 11,370.00 Liquor Tax Commission $ 303.06 $ 228.04 $ 289.49 $ 335.21 $ 359.88 $ 393.17 $ 393.96 $ 305.97 $ 332.09 $ 340.33 Other Income $ 2.803.50 $ $ 364.10 $ 34.11 $ $ $ 572.38 $ $ $ Total Other Revenue $ 60,598.59 $ 58,460.14 $ 60,964.81 $ 45,964.91 $ 49,839.86 $ 51,536.88 $ 49,846.42 $ 46,695.62 $ 45,135.81 $ 45,614.54 Total Revenue $714,852.32 $ 768,875.64 $925,133.46 $ 910,440.90 $ 858,341.13 $933,117.74 $1,021,039.36 $ 859,870.77 $ 962,722.35 $955,520.31 Total Cost of Goods Sold $199,751.67 $206,920.11 $ 236,001.85 $ 230,585.91 $ 184,985.83 $ 214,445.82 $ 208,807.90 $ 183,851.73 $ 216,956.53 $215,505.47 Gross Income $515,100.65 $561,955.53 $ 689,131.61 $ 679,854.99 $ 673,355.30 $ 718,671.92 $ 812,231.46 $676,019.04 $ 745,765.82 $ 740,014.85 Expenses Total Selling and General Expenses $ 101,614.14 $104,157.57 $ 129,375.92 $ 119,461.77 $ 127,393.66 $ 140,960.08 $ 145,315.42 $ 90,040.42 $ 130,133.12 $130,565.89 Total Administration Charges Bonus $406,670.69 $ 462,463.66 $ 510,881.09 $ 565,598.86 $ 561,647.16 $587,312.31 $ 624,561.30 $624,368.84 $ 655,985.44 $652,593.08 Total Operating Expenses $508,284.83 $566,621.23 $ 640,257 01 $ 685,060.64 $ 689,040.83 $728,272.39 $ 769,876.72 $714,409.25 $ 786,118.56 $783,158.97 Net Income $ 6,815.81 $ 4,665.70 $ 48,874.59 $ 5,205.64 -$ 15,685.53 -$ 9,600.46 $ 42,354.74 $ 38,390.21 -$ 40,352.74 $ 43, 144.12 EXHIBIT 2: AVERAGE RATIOS FOR THE TWO OTHER CANADIAN UNIVERSITY CLUBS Average Comparable 1.11 Current ratio Quick ratio Total asset turnover 0.97 1.50 8.07 45.48 13.10 27.86 Receivable turnover Average collection period Inventory turnover Days in inventory Debt ratio Debt-to-equity ratio Gross profit margin Net profit margin 0.31 0.44 0.67 -0.02Step by Step Solution
There are 3 Steps involved in it
Step: 1

Get Instant Access to Expert-Tailored Solutions
See step-by-step solutions with expert insights and AI powered tools for academic success
Step: 2

Step: 3
Ace Your Homework with AI
Get the answers you need in no time with our AI-driven, step-by-step assistance
Get Started
Guardians Of Finance
Authors: James R. Barth, Gerard Caprio, Ross Levine
1st Edition
0262526840, 978-0262526845