unsure on scatterplot features and why overall is negative?
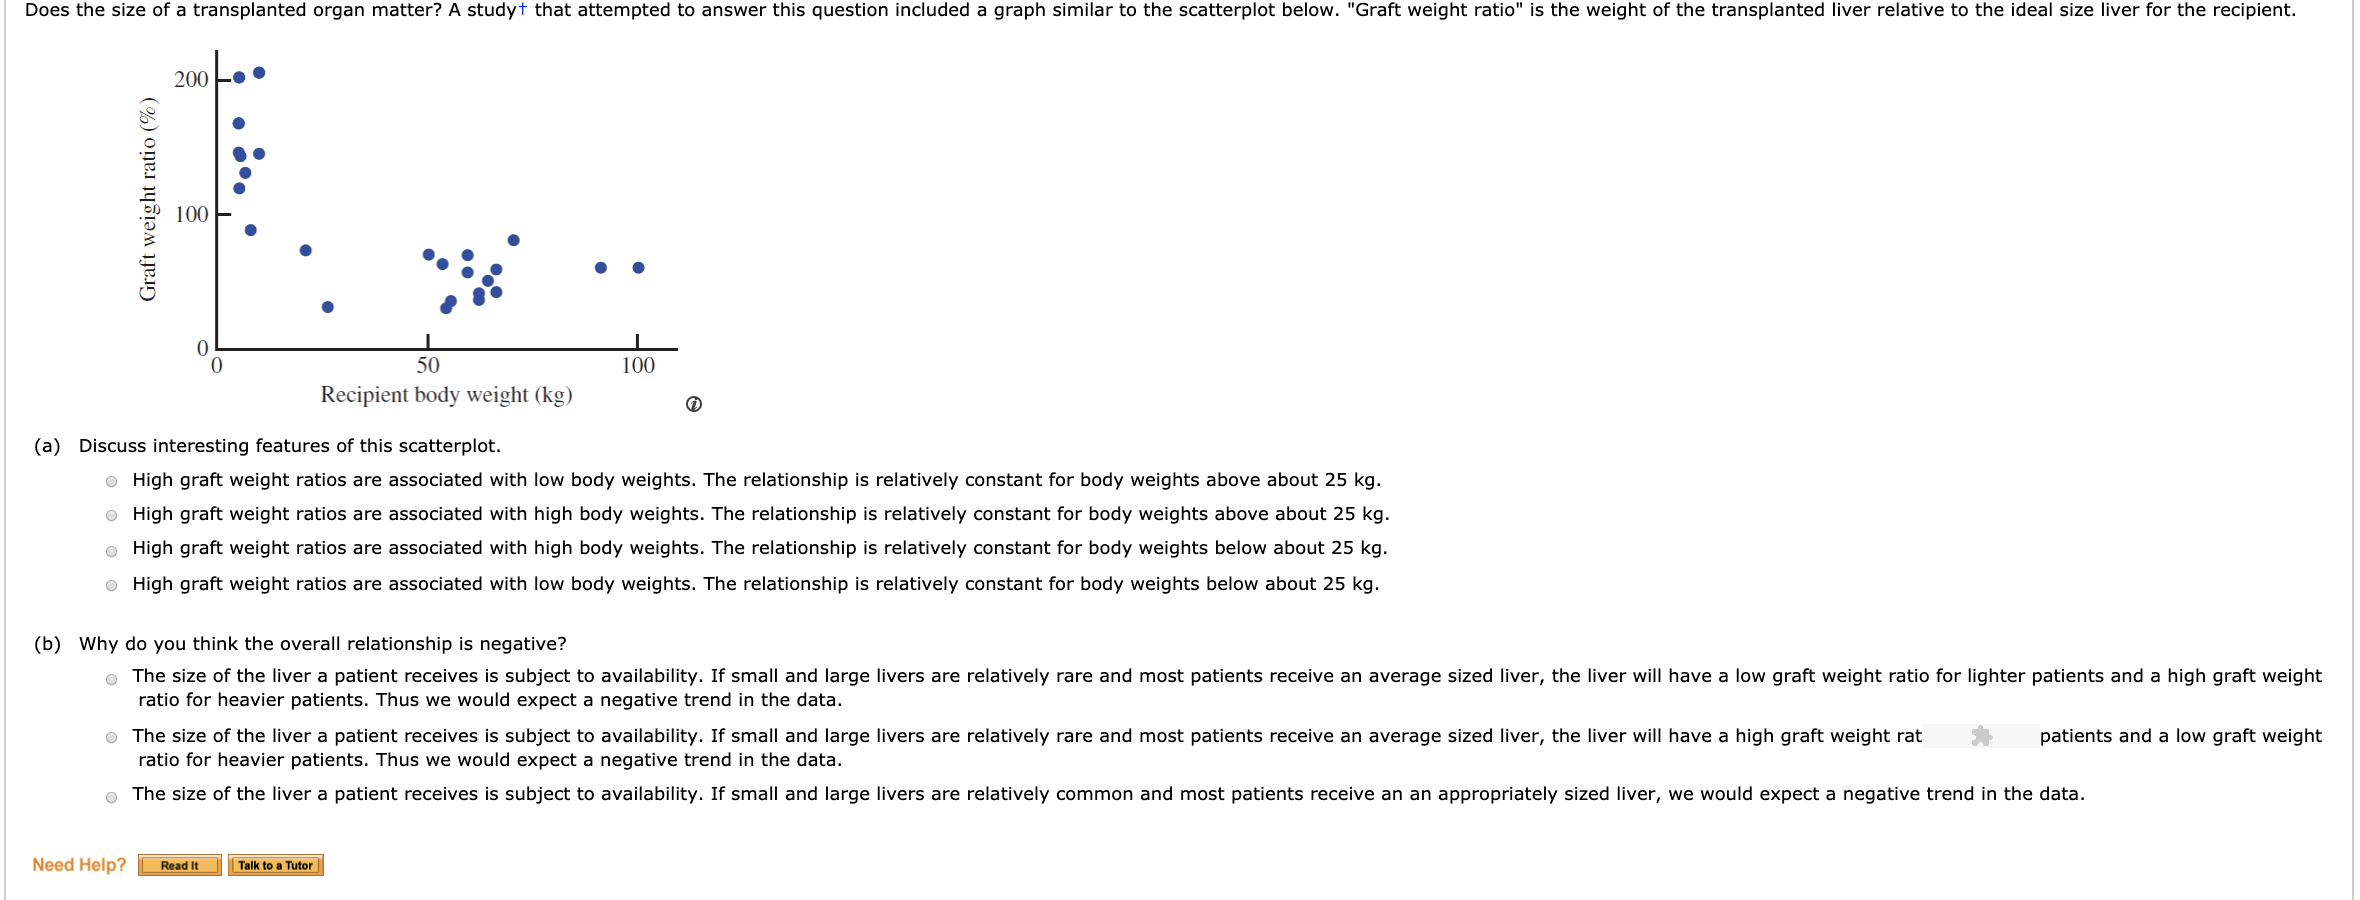
Does the size of a transplanted organ matter? A study that attempted to answer this question included a graph similar to the scatterplot below. "Graft weight ratio" is the weight of the transplanted liver relative to the ideal size liver for the recipient. 200. Graft weight ratio (%) . .. . 100 50 100 Recipient body weight (kg) (a) Discuss interesting features of this scatterplot. . High graft weight ratios are associated with low body weights. The relationship is relatively constant for body weights above about 25 kg. . High graft weight ratios are associated with high body weights. The relationship is relatively constant for body weights above about 25 kg. o High graft weight ratios are associated with high body weights. The relationship is relatively constant for body weights below about 25 kg. . High graft weight ratios are associated with low body weights. The relationship is relatively constant for body weights below about 25 kg. (b) Why do you think the overall relationship is negative? The size of the liver a patient receives is subject to availability. If small and large livers are relatively rare and most patients receive an average sized liver, the liver will have a low graft weight ratio for lighter patients and a high graft weight ratio for heavier patients. Thus we would expect a negative trend in the data. . The size of the liver a patient receives is subject to availability. If small and large livers are relatively rare and most patients receive an average sized liver, the liver will have a high graft weight rat patients and a low graft weight ratio for heavier patients. Thus we would expect a negative trend in the data. o The size of the liver a patient receives is subject to availability. If small and large livers are relatively common and most patients receive an an appropriately sized liver, we would expect a negative trend in the data. Need Help? Read It Talk to a Tutor