updated
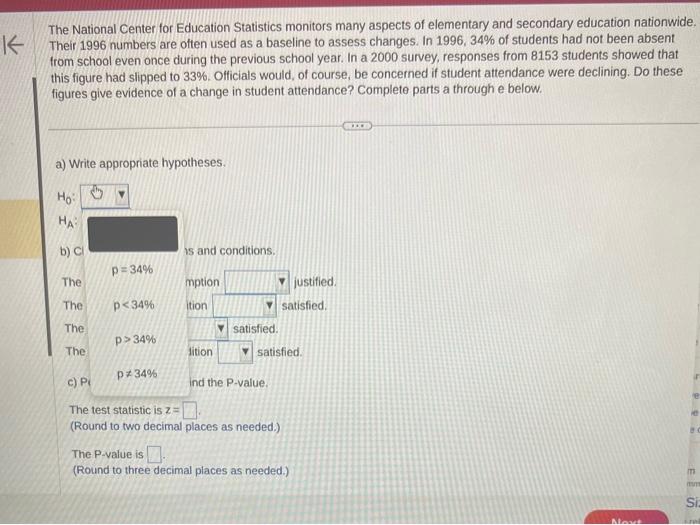
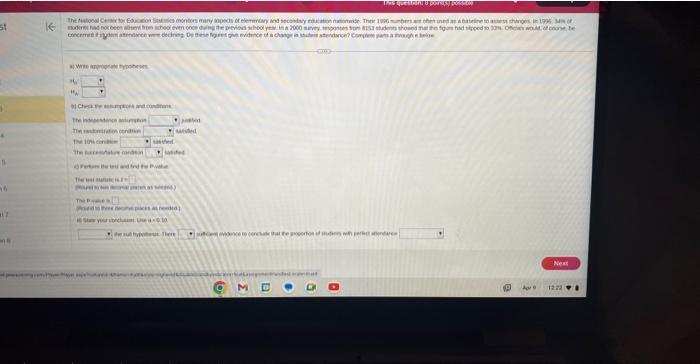
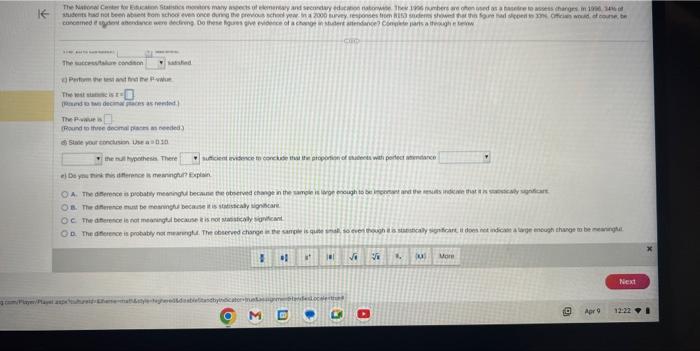
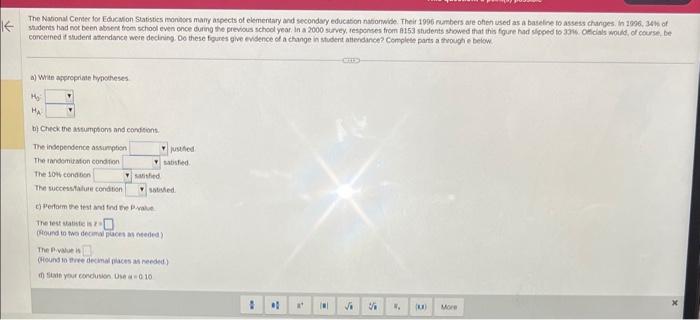
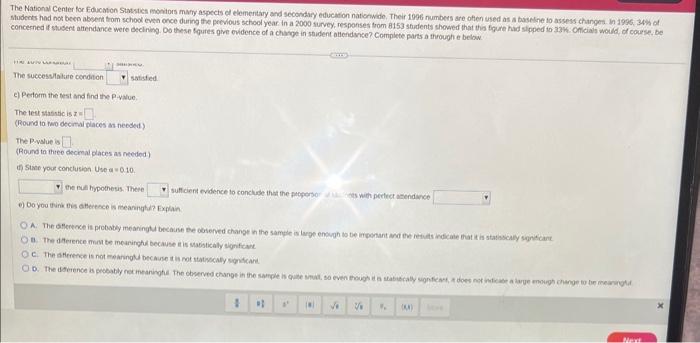
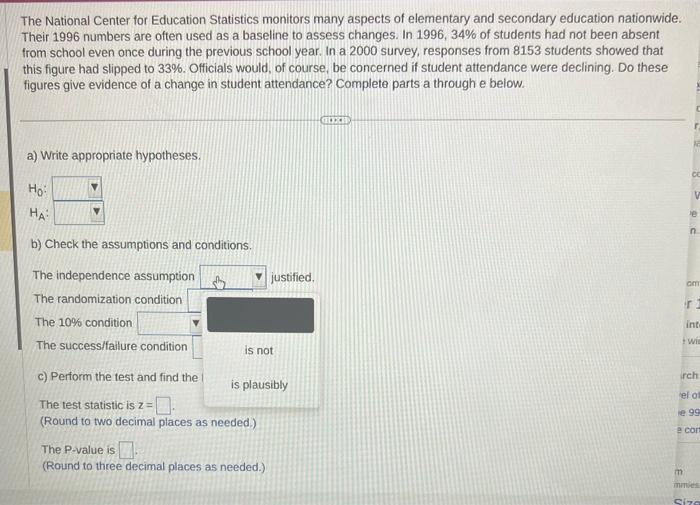
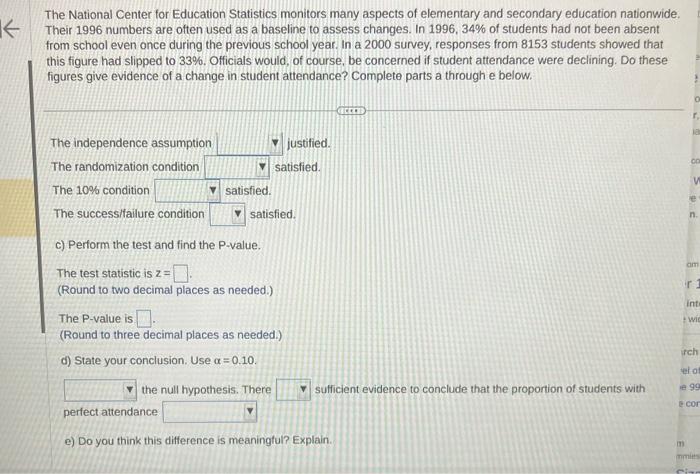
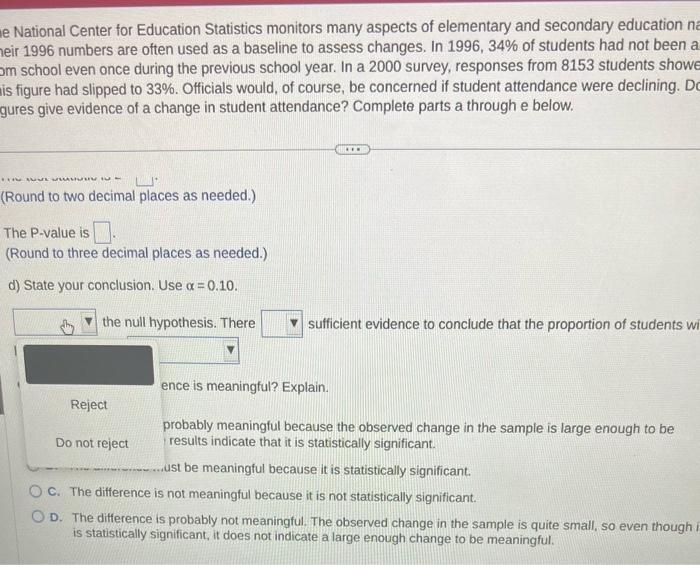
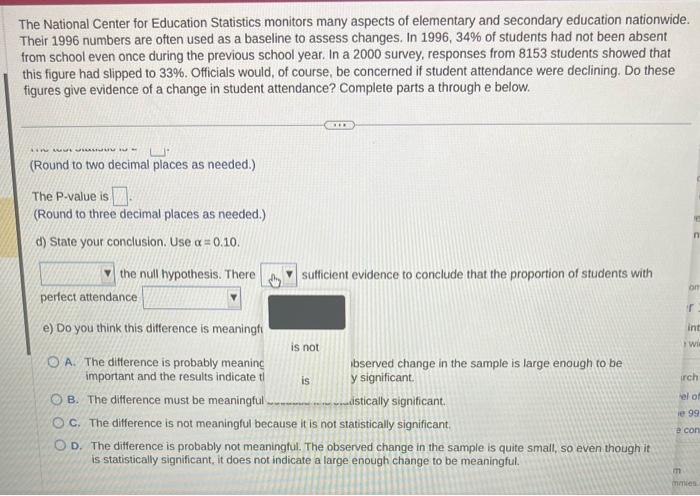
The wit tisencis is is The piswue is P Pound to thee docmal phach m neededs concerned t sudent atendance were decining. Oo these figares give evisence d a change in student atendance? Complete parts a thoovghe betow a) Wiste appropriate typotheses bi Chek the astumpors and contsunt The independence assumpten The lamdemitation conditon The 104 conation The succentaluie condtion sotuted c) Hertorm He test wai tnd to p.rale The leu yathice is r : (Round io tho decarw pacet at oteded) The Bivale is (Houns o trire decimal flacts as needed) (i) staib yeur condusion ose a 0.10 conceened it stusent attendance were declining. Do thewe Goures give evidence of a chavge in stident ablendvrise? Complece parts a through e below. The succestialire condition sotsiced c) Petorm the test and find the P-yNue The teet stasnic is z w (Round to two decital places is neesed) The P-vilue is (Round to thee decmad places as needed) if Stme your conclusion Use a =010. the nat hypothesis. There sulfient evidence to conctuse that the phopersor a iu wats with pertuct acendince e) Do you tuini tois aberence wn mearingtur Explan a. The daterence mas be mearifphd becayse eis sasbicaly significale. C. The atirence is not me aringtu beciuse t is not tativicaly signicare The National Center for Education Statistics monitors many aspects of elementary and secondary education nationwide. Their 1996 numbers are otten used as a baseline to assess changes. In 1996,34% of students had not been absent from school even once during the previous school year. In a 2000 survey, responses from 8153 students showed that this figure had slipped to 33%. Officials would, of course, be concerned if student attendance were declining. Do these figures give evidence of a change in student attendance? Complete parts a through e below. a) Write appropriate hypotheses. H0 HA b) Cl is and conditions. The p=34% justified. The satisfied. The satisfied. The c) pip=34% ind the P-value. The test statistic is z= (Round to two decimal places as needed.) The P-value is (Round to three decimal places as needed.) The National Center for Education Statistics monitors many aspects of elementary and secondary education nationwide. Their 1996 numbers are often used as a baseline to assess changes. In 1996,34% of students had not been absent from school even once during the previous school year. In a 2000 survey, responses from 8153 students showed that this figure had slipped to 33%. Officials would, of course, be concerned if student attendance were declining. Do these figures give evidence of a change in student attendance? Complete parts a through e below. a) Write appropriate hypotheses. HO0 HA b) Check the assumptions and conditions. The independence assumption justified. The randomization condition The 10% condition The success/failure condition is not c) Perform the test and find the is plausibly The lest statistic is z = (Round to two decimal places as needed.) The P-value is (Round to three decimal places as needed.) The National Center for Education Statistics monitors many aspects of elementary and secondary education nationwide. Their 1996 numbers are often used as a baseline to assess changes. In 1996,34% of students had not been absent from school even once during the previous school year. In a 2000 survey, responses from 8153 students showed that this figure had slipped to 33%. Officials would, of course, be concerned if student attendance were declining. Do these figures give evidence of a change in student attendance? Complete parts a through e below. The independence assumption justified. The randomization condition satisfied. The 10% condition satisfied. The successifailure condition satisfied. c) Perform the test and find the P-value. The test statistic is z= (Round to two decimal places as needed.) The P-value is (Round to three decimal places as needed.) d) State your conclusion. Use =0.10. the null hypothesis. There sufficient evidence to conclude that the proportion of students with perfect attendance e) Do you think this difference is meaningtul? Explain. e National Center for Education Statistics monitors many aspects of elementary and secondary education ne eir 1996 numbers are often used as a baseline to assess changes. In 1996,34% of students had not been a om school even once during the previous school year. In a 2000 survey, responses from 8153 students showe is figure had slipped to 33%. Officials would, of course, be concerned if student attendance were declining. D gures give evidence of a change in student attendance? Complete parts a through e below. (Round to two decimal places as needed.) The P-value is (Round to three decimal places as needed.) d) State your conclusion. Use =0.10. the null hypothesis. There sufficient evidence to conclude that the proportion of students w ence is meaningtul? Explain. Reject probably meaningful because the observed change in the sample is large enough to be Do not reject results indicate that it is statistically significant. ust be meaningful because it is statistically significant. C. The difference is not meaningful because it is not statistically significant. D. The difference is probably not meaningful. The observed change in the sample is quite small, so even though is statistically significant, it does not indicate a large enough change to be meaningful. The National Center for Education Statistics monitors many aspects of elementary and secondary education nationwide. Their 1996 numbers are often used as a baseline to assess changes. In 1996,34% of students had not been absent from school even once during the previous school year. In a 2000 survey, responses from 8153 students showed that this figure had slipped to 33%. Officials would, of course, be concerned if student attendance were declining. Do these figures give evidence of a change in student attendance? Complete parts a through e below. (Round to two decimal places as needed.) The P-value is (Round to three decimal places as needed.) d) State your conclusion. Use =0.10. the null hypothesis. There sulficient evidence to conclude that the proportion of students with perfect attendance e) Do you think this difference is meaningf is not A. The difference is probably meaninc bbserved change in the sample is large enough to be important and the results indicate ti is y significant. B. The difference must be meaningful C. The difference is not meaningful because it is not statistically significant. D. The difference is probably not meaningtul. The observed change in the sample is quite small, so even though it is statistically significant, it does not indicate a large enough change to be meaningful. The National Center for Education Stafistics monitors many aspects of elementary and secondary educaton nationwic Thear 1996 numbers are oten used as a baseline to assess changes. In 1996,349 of students had not been absent from school even once during the previous school year. In a 2000 survcy, responses from 8153 students showed that this foure had slipped to 33\%t. Officials would, of course, be concemed it shudent attendance were declining. Do these ligures gve evidence of a change in studen attiendance? Complete parts a through e below. (Round to two decinsal places as necded) The Puvalue is (Round ta shice decimal places as necded.) d) Stame your conclusign. Use a=0.10. sufficiert evidence to conclude that the proporion of students with pertect athethance e) Do you think this A. The differen Fa.re the obsened change in the sampie is large enough to be keportard at has not changed. is sumisaicaly sorificare. B. The ditteren has decreased C. The difterin tis inot itenstiesby signticart. has changed. D. The dintereh. is statirticall has incrensed The chiserine chwoe in tre saniple is quite seal 30 even though if The wit tisencis is is The piswue is P Pound to thee docmal phach m neededs concerned t sudent atendance were decining. Oo these figares give evisence d a change in student atendance? Complete parts a thoovghe betow a) Wiste appropriate typotheses bi Chek the astumpors and contsunt The independence assumpten The lamdemitation conditon The 104 conation The succentaluie condtion sotuted c) Hertorm He test wai tnd to p.rale The leu yathice is r : (Round io tho decarw pacet at oteded) The Bivale is (Houns o trire decimal flacts as needed) (i) staib yeur condusion ose a 0.10 conceened it stusent attendance were declining. Do thewe Goures give evidence of a chavge in stident ablendvrise? Complece parts a through e below. The succestialire condition sotsiced c) Petorm the test and find the P-yNue The teet stasnic is z w (Round to two decital places is neesed) The P-vilue is (Round to thee decmad places as needed) if Stme your conclusion Use a =010. the nat hypothesis. There sulfient evidence to conctuse that the phopersor a iu wats with pertuct acendince e) Do you tuini tois aberence wn mearingtur Explan a. The daterence mas be mearifphd becayse eis sasbicaly significale. C. The atirence is not me aringtu beciuse t is not tativicaly signicare The National Center for Education Statistics monitors many aspects of elementary and secondary education nationwide. Their 1996 numbers are otten used as a baseline to assess changes. In 1996,34% of students had not been absent from school even once during the previous school year. In a 2000 survey, responses from 8153 students showed that this figure had slipped to 33%. Officials would, of course, be concerned if student attendance were declining. Do these figures give evidence of a change in student attendance? Complete parts a through e below. a) Write appropriate hypotheses. H0 HA b) Cl is and conditions. The p=34% justified. The satisfied. The satisfied. The c) pip=34% ind the P-value. The test statistic is z= (Round to two decimal places as needed.) The P-value is (Round to three decimal places as needed.) The National Center for Education Statistics monitors many aspects of elementary and secondary education nationwide. Their 1996 numbers are often used as a baseline to assess changes. In 1996,34% of students had not been absent from school even once during the previous school year. In a 2000 survey, responses from 8153 students showed that this figure had slipped to 33%. Officials would, of course, be concerned if student attendance were declining. Do these figures give evidence of a change in student attendance? Complete parts a through e below. a) Write appropriate hypotheses. HO0 HA b) Check the assumptions and conditions. The independence assumption justified. The randomization condition The 10% condition The success/failure condition is not c) Perform the test and find the is plausibly The lest statistic is z = (Round to two decimal places as needed.) The P-value is (Round to three decimal places as needed.) The National Center for Education Statistics monitors many aspects of elementary and secondary education nationwide. Their 1996 numbers are often used as a baseline to assess changes. In 1996,34% of students had not been absent from school even once during the previous school year. In a 2000 survey, responses from 8153 students showed that this figure had slipped to 33%. Officials would, of course, be concerned if student attendance were declining. Do these figures give evidence of a change in student attendance? Complete parts a through e below. The independence assumption justified. The randomization condition satisfied. The 10% condition satisfied. The successifailure condition satisfied. c) Perform the test and find the P-value. The test statistic is z= (Round to two decimal places as needed.) The P-value is (Round to three decimal places as needed.) d) State your conclusion. Use =0.10. the null hypothesis. There sufficient evidence to conclude that the proportion of students with perfect attendance e) Do you think this difference is meaningtul? Explain. e National Center for Education Statistics monitors many aspects of elementary and secondary education ne eir 1996 numbers are often used as a baseline to assess changes. In 1996,34% of students had not been a om school even once during the previous school year. In a 2000 survey, responses from 8153 students showe is figure had slipped to 33%. Officials would, of course, be concerned if student attendance were declining. D gures give evidence of a change in student attendance? Complete parts a through e below. (Round to two decimal places as needed.) The P-value is (Round to three decimal places as needed.) d) State your conclusion. Use =0.10. the null hypothesis. There sufficient evidence to conclude that the proportion of students w ence is meaningtul? Explain. Reject probably meaningful because the observed change in the sample is large enough to be Do not reject results indicate that it is statistically significant. ust be meaningful because it is statistically significant. C. The difference is not meaningful because it is not statistically significant. D. The difference is probably not meaningful. The observed change in the sample is quite small, so even though is statistically significant, it does not indicate a large enough change to be meaningful. The National Center for Education Statistics monitors many aspects of elementary and secondary education nationwide. Their 1996 numbers are often used as a baseline to assess changes. In 1996,34% of students had not been absent from school even once during the previous school year. In a 2000 survey, responses from 8153 students showed that this figure had slipped to 33%. Officials would, of course, be concerned if student attendance were declining. Do these figures give evidence of a change in student attendance? Complete parts a through e below. (Round to two decimal places as needed.) The P-value is (Round to three decimal places as needed.) d) State your conclusion. Use =0.10. the null hypothesis. There sulficient evidence to conclude that the proportion of students with perfect attendance e) Do you think this difference is meaningf is not A. The difference is probably meaninc bbserved change in the sample is large enough to be important and the results indicate ti is y significant. B. The difference must be meaningful C. The difference is not meaningful because it is not statistically significant. D. The difference is probably not meaningtul. The observed change in the sample is quite small, so even though it is statistically significant, it does not indicate a large enough change to be meaningful. The National Center for Education Stafistics monitors many aspects of elementary and secondary educaton nationwic Thear 1996 numbers are oten used as a baseline to assess changes. In 1996,349 of students had not been absent from school even once during the previous school year. In a 2000 survcy, responses from 8153 students showed that this foure had slipped to 33\%t. Officials would, of course, be concemed it shudent attendance were declining. Do these ligures gve evidence of a change in studen attiendance? Complete parts a through e below. (Round to two decinsal places as necded) The Puvalue is (Round ta shice decimal places as necded.) d) Stame your conclusign. Use a=0.10. sufficiert evidence to conclude that the proporion of students with pertect athethance e) Do you think this A. The differen Fa.re the obsened change in the sampie is large enough to be keportard at has not changed. is sumisaicaly sorificare. B. The ditteren has decreased C. The difterin tis inot itenstiesby signticart. has changed. D. The dintereh. is statirticall has incrensed The chiserine chwoe in tre saniple is quite seal 30 even though if
