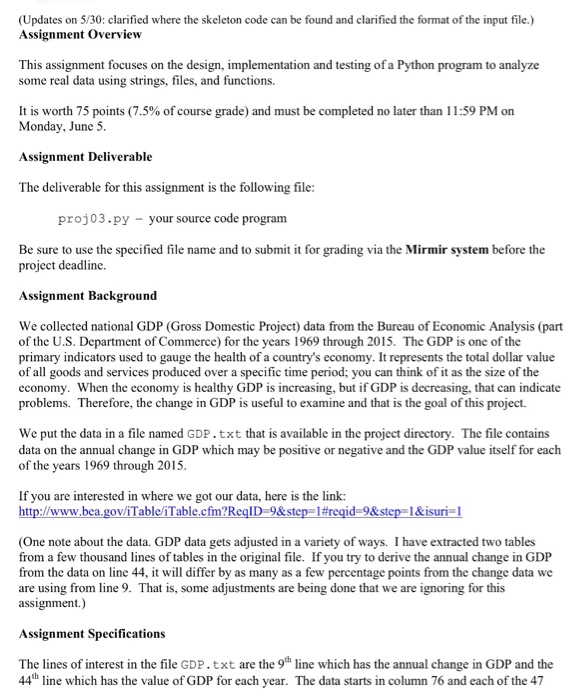
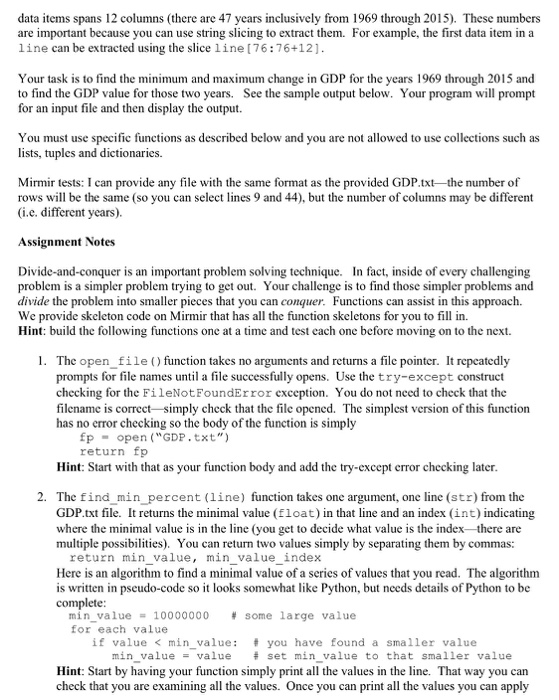
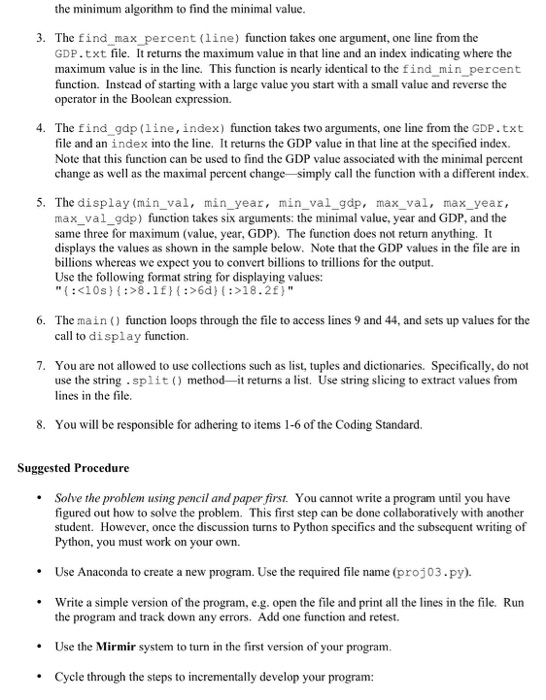
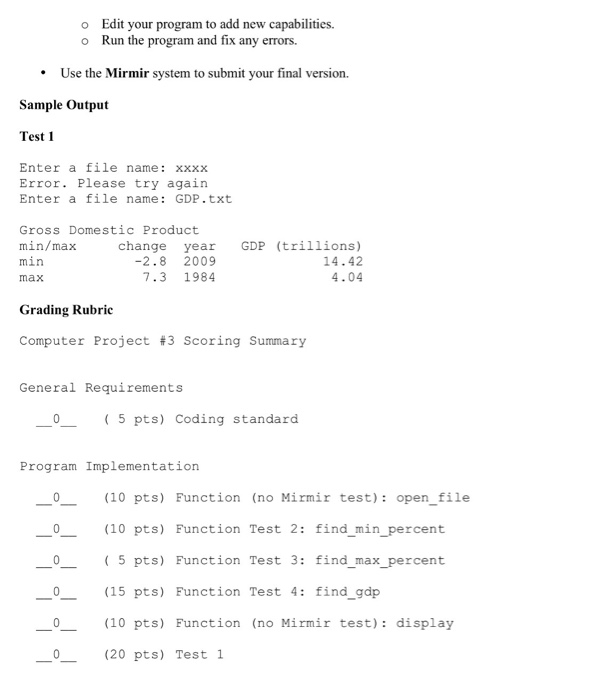
(Updates on 5/30: clarified where the skeleton code can be found and clarified the format of the input file. Assignment overview This assignment focuses on the design, implementation and testing ofa Python program to analyze some real data using strings, files, and functions It is worth 75 points (7.5% of course grade) and must be completed no later than 11:59 PM on Monday, June 5 Assignment Deliverable The deliverable for this assignment is the following file proj03.py your source code program Be sure to use the specified file name and to submit it for grading via the Mirmir system before the project deadline. Assignment Background We collected national GDP (Gross Domestic Project) data from the Bureau of Economic Analysis (part of the U.S. Department of Commerce) for the years 1969 through 2015. The GDP is one of the primary indicators used to gauge the health of a country's economy. It represents the total dollar value of all goods and services produced over a specific time period; you can think of it as the size of the economy. When the economy is healthy GDP is increasing, but if GDP is decreasing, that can indicate problems. Therefore, the change in GDP is useful to examine and that is the goal ofthis project. We put the data in a file named GDP.txt that is available in the project directory. The file contains data on the annual change in GDP which may be positive or negative and the GDP value itself for each of the years 1969 through 2015 If you are interested in where we got our data, here is the link: http://www.bea.gov/iTable/iTable.cfm?R Da 9&step da 9 1&isuri l (One note about the data. GDP data gets adjusted in a variety of ways. Ihave extracted two tables from a few thousand lines of tables in the original file. If you try to derive the annual change in GDP from the data on line 44, it will differ by as many as a few percentage points from the change data we are using from line 9. That is, some adjustments are being done that we are ignoring for this assignment.) Assignment Specifications t are the 9 line which has the annual change in GDP and the The lines of interest in the file GDP 44th line which has the value of GDP for each year. The data starts in column 76 and each of the 47


