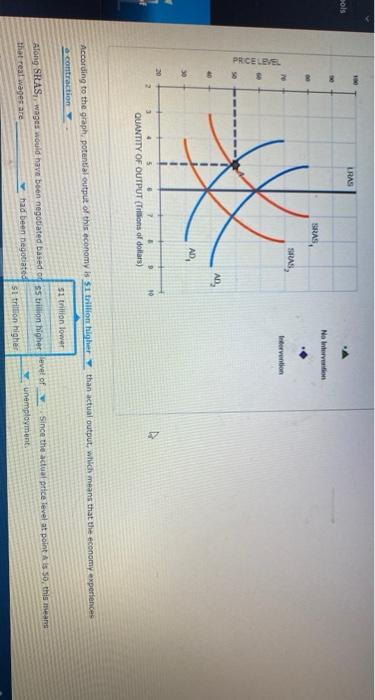
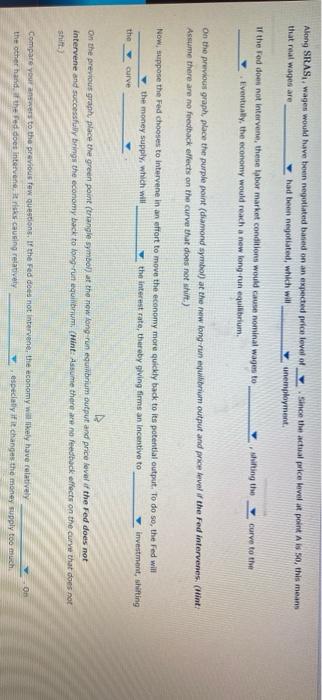
URAS sols 8 No Inter 8 SPAS Intervention 3 & PRCELEJE 4 AD AD 30 20 10 2 QUANTITY OF OUTPUT(Trilions of dollars) According to the graph potential output of this economy is $1 trillion bulgher than actual output, which means that the economy experiences a contraction 51 trillion lower Along SRAS, wages would have been negotiated based od s trillion higher level of Since the actual price level at point is 50 this means that real wages are had been negotiated unemployment Si trillion higher Along SRAS. wages would have been negotiated based on an expected price level of Since the actual price level at point AS, this means that real wages are had been negotiated, which will unemployment, If the red does not intervene, these labor market conditions would cause nominal wages to Eventually, the economy would reach a new long run equilibrium. hitting the Curve to the on the previous graph, place the purple point (diamond symbol) at the new long-run equilibrium output and price level ir the Fed intervenes, Clint Assume there are no feedback effects on the curve that does not hurt.) Now, suppose the Fed chooses to intervene in an effort to move the economy more quickly back to its potential output. To do so, the Fed will the money supply, which will the interest rate, thereby giving firms an Incentive to investment, shifting curve the On the previous graph place the green point (triangle symbol) at the new long-run equilibrium output and price level of the Fed does not Intervene and successfully brings the economy back to long-rungorum (Hint: Assume there are no hack effects on the curve that does not shift Compare your answers to the previous few questions. If the Fed does not intervene, the economy wiely have relatively the other hand, the Fed does intervene triks causing relatively especially if it changes the money supply too much On