

Answered step by step
Verified Expert Solution
Question
1 Approved Answer
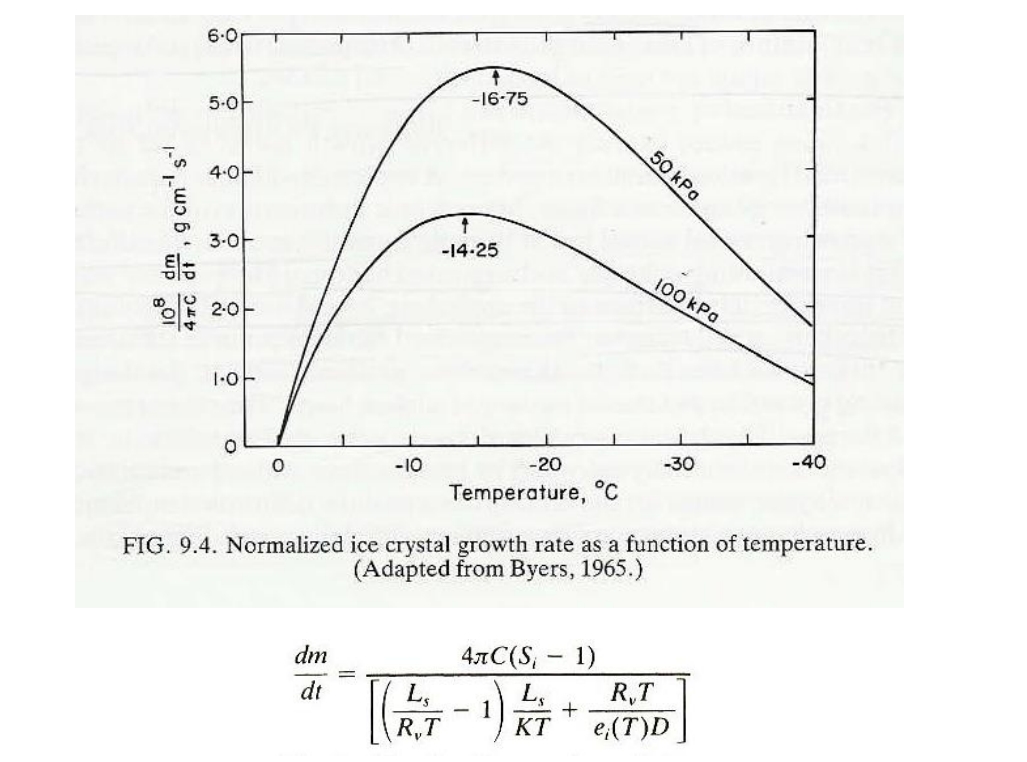
URGENT!!! FIG. 9 . 4 . Normalized ice crystal growth rate as a function of temperature. ( Adapted from Byers, 1 9 6 5 .
URGENT!!! FIG. Normalized ice crystal growth rate as a function of temperature. Adapted from Byers,
The above figure shows the Normalized ice crystal growth rate as a function of temperature for two different pressures, indicating that it reaches a maximum around Using the above formula, draw a graph representing the Normalized ice crystal growth rate as a function of temperature for kPa and kPa, and explain the solving process in detail provide programming code
In the above formula, C has different values depending on the shape of the ice crystal, and Si represents the saturation ratio of ice under saturated conditions for water and is a function of temperature. K is the Thermal conductivity of air, which is a function of temperature, and D is the Diffusion coefficient of water vapor, which is a function of temperature and pressure.
Step by Step Solution
There are 3 Steps involved in it
Step: 1

Get Instant Access to Expert-Tailored Solutions
See step-by-step solutions with expert insights and AI powered tools for academic success
Step: 2

Step: 3
Ace Your Homework with AI
Get the answers you need in no time with our AI-driven, step-by-step assistance
Get Started
Database And Expert Systems Applications Dexa 2021 Workshops Biokdd Iwcfs Mlkgraphs Al Cares Protime Alsys 2021 Virtual Event September 27 30 2021 Proceedings
Authors: Gabriele Kotsis ,A Min Tjoa ,Ismail Khalil ,Bernhard Moser ,Atif Mashkoor ,Johannes Sametinger ,Anna Fensel ,Jorge Martinez-Gil ,Lukas Fischer
1st Edition
3030871002, 978-3030871000