

Answered step by step
Verified Expert Solution
Question
1 Approved Answer
Urgent IS 2,3 P5-36. Analysis and Interpretation of Return on Investment for Competitors Balance sheets and income statements for Nike, Inc., and Adidas Group follow.
Urgent
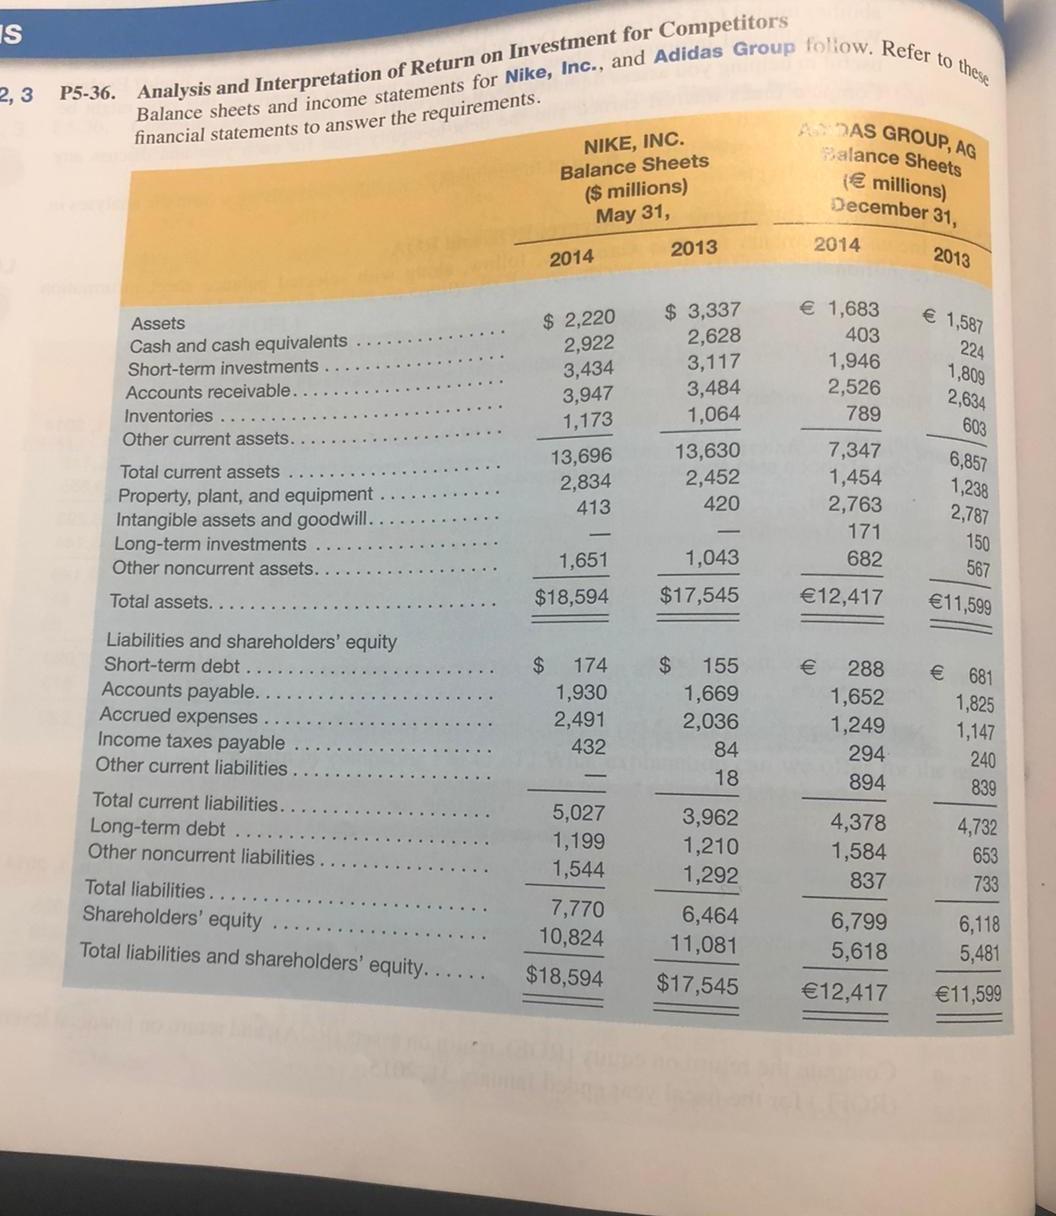
IS 2,3 P5-36. Analysis and Interpretation of Return on Investment for Competitors Balance sheets and income statements for Nike, Inc., and Adidas Group follow. Refer to these financial statements to answer the requirements. NIKE, INC. Balance Sheets ($ millions) May 31, HAS GROUP, AG Salance Sheets millions) December 31, 2014 2013 2014 2013 Assets Cash and cash equivalents Short-term investments Accounts receivable. Inventories.. Other current assets. $ 2,220 2,922 3,434 3,947 1,173 $ 3,337 2,628 3,117 3,484 1,064 1,683 403 1,946 2,526 789 1,587 224 1,809 2,634 603 13,696 2,834 413 13,630 2,452 420 Total current assets Property, plant, and equipment Intangible assets and goodwill. Long-term investments Other noncurrent assets. 7,347 1,454 2,763 171 682 6,857 1,238 2,787 150 567 1,651 1,043 $17,545 Total assets.. $18,594 12,417 11,599 Liabilities and shareholders' equity Short-term debt Accounts payable. Accrued expenses Income taxes payable Other current liabilities Total current liabilities. Long-term debt Other noncurrent liabilities $ 174 1,930 2,491 432 $ 155 1,669 2,036 84 18 288 1,652 1,249 294 894 681 1,825 1,147 240 839 5,027 1,199 1,544 3,962 1,210 1,292 4,378 1,584 837 4,732 653 733 Total liabilities.. Shareholders' equity Total liabilities and shareholders' equity...... 7,770 10,824 6,464 11,081 $17,545 6,799 5,618 6,118 5,481 $18,594 12,417 11,599 IS 2,3 P5-36. Analysis and Interpretation of Return on Investment for Competitors Balance sheets and income statements for Nike, Inc., and Adidas Group follow. Refer to these financial statements to answer the requirements. NIKE, INC. Balance Sheets ($ millions) May 31, HAS GROUP, AG Salance Sheets millions) December 31, 2014 2013 2014 2013 Assets Cash and cash equivalents Short-term investments Accounts receivable. Inventories.. Other current assets. $ 2,220 2,922 3,434 3,947 1,173 $ 3,337 2,628 3,117 3,484 1,064 1,683 403 1,946 2,526 789 1,587 224 1,809 2,634 603 13,696 2,834 413 13,630 2,452 420 Total current assets Property, plant, and equipment Intangible assets and goodwill. Long-term investments Other noncurrent assets. 7,347 1,454 2,763 171 682 6,857 1,238 2,787 150 567 1,651 1,043 $17,545 Total assets.. $18,594 12,417 11,599 Liabilities and shareholders' equity Short-term debt Accounts payable. Accrued expenses Income taxes payable Other current liabilities Total current liabilities. Long-term debt Other noncurrent liabilities $ 174 1,930 2,491 432 $ 155 1,669 2,036 84 18 288 1,652 1,249 294 894 681 1,825 1,147 240 839 5,027 1,199 1,544 3,962 1,210 1,292 4,378 1,584 837 4,732 653 733 Total liabilities.. Shareholders' equity Total liabilities and shareholders' equity...... 7,770 10,824 6,464 11,081 $17,545 6,799 5,618 6,118 5,481 $18,594 12,417 11,599Step by Step Solution
There are 3 Steps involved in it
Step: 1

Get Instant Access to Expert-Tailored Solutions
See step-by-step solutions with expert insights and AI powered tools for academic success
Step: 2

Step: 3
Ace Your Homework with AI
Get the answers you need in no time with our AI-driven, step-by-step assistance
Get Started
Financial Accounting
Authors: David Spiceland
6th Edition
1265889716, 978-1265889715