urgent please help me. Thank you


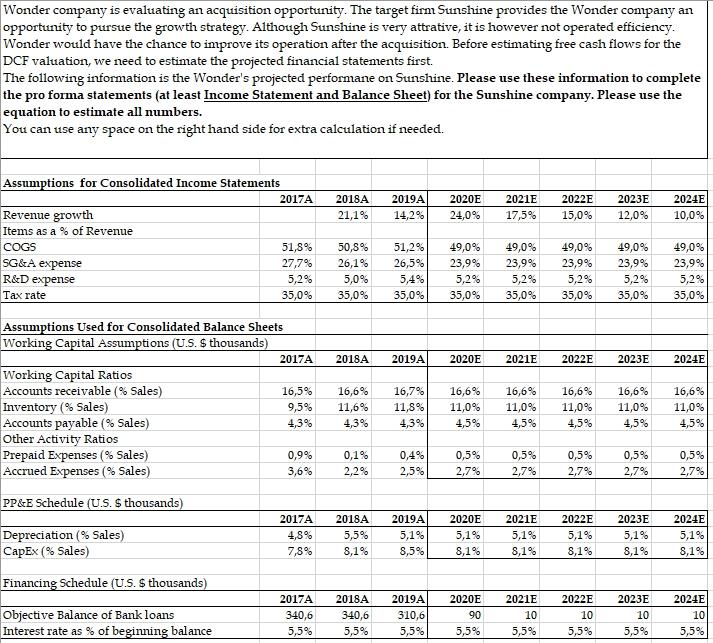
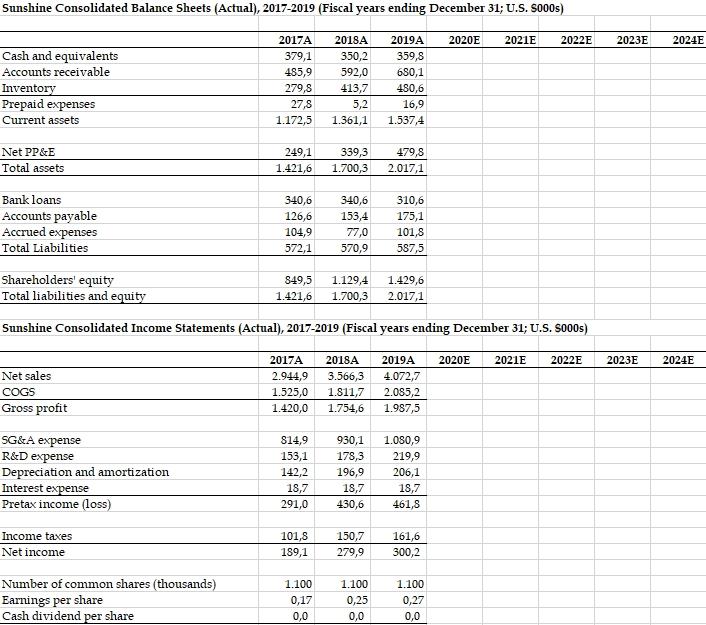
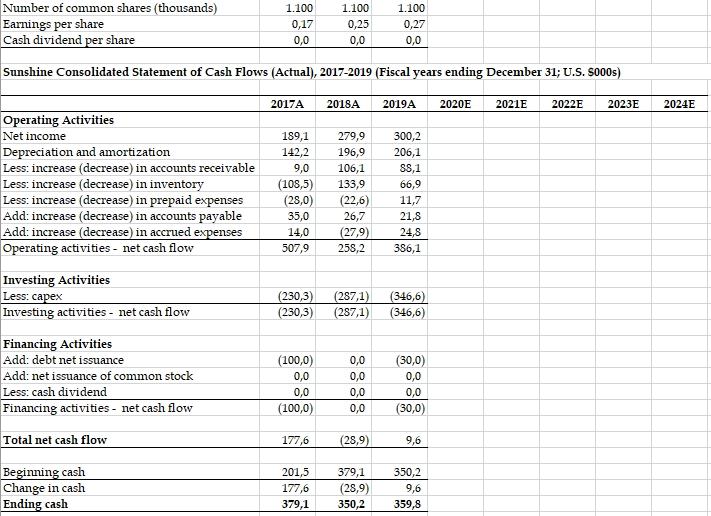
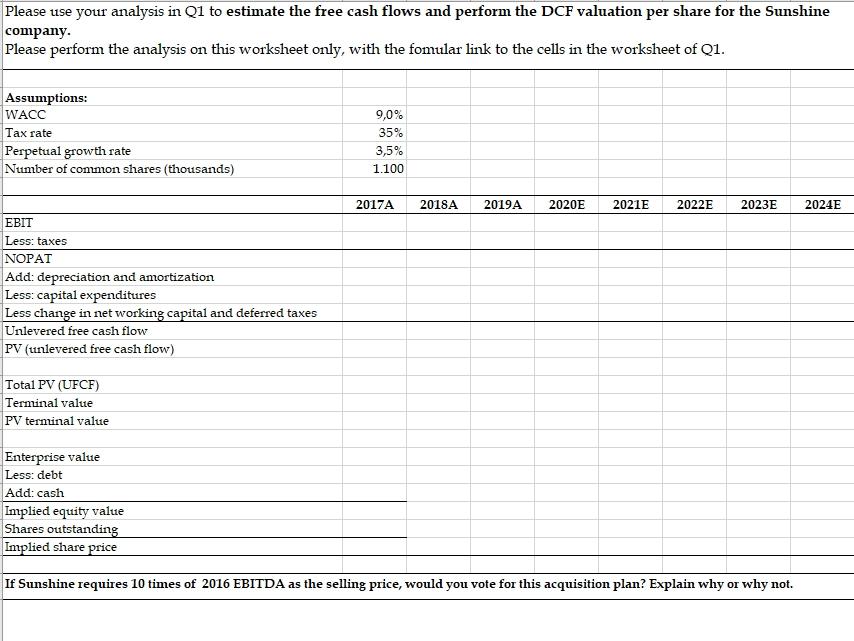
Wonder company is evaluating an acquisition opportunity. The target firm Sunshine provides the Wonder company an opportunity to pursue the growth strategy. Although Sunshine is very attrative, it is however not operated efficiency. Wonder would have the chance to improve its operation after the acquisition. Before estimating free cash flows for the DCF valuation, we need to estimate the projected financial statements first. The following information is the Wonder's projected performane on Sunshine. Please use these information to complete the pro forma statements (at least Income Statement and Balance Sheet) for the Sunshine company. Please use the equation to estimate all numbers. You can use any space on the right hand side for extra calculation if needed. Assumptions for Consolidated Income Statements 2017A 2018A 2019A 2020E 2021E 2022E 2023E 2024E 21,1% 14,2% 24,0% 17,5% 15,0% 12,0% 10,0% Revenue growth Items as a % of Revenue COGS SG&A expense R&D expense Tax rate 51,2% 26,5% 51,8% 27,7% 5,2% 35,0% 50,8% 26,1% 5,0% 35,0% 49,0% 23,9% 5,2% 35,0% 49,0% 23,9% 5,2% 35,0% 49,0% 23,9% 5,2% 35,0% 49,0% 23,9% 5,2% 35,0% 49,0% 23,9% 5,2% 35,0% 5,4% 35,0% Assumptions Used for Consolidated Balance Sheets Working Capital Assumptions (U.S. $ thousands) 2017A 2018A 2019A 2020E 2021E 2022E 2023E 2024E 16,7% Working Capital Ratios Accounts receivable % Sales) Inventory (% Sales) Accounts payable (% Sales) Other Activity Ratios Prepaid Expenses (% Sales) Accrued Expenses (% Sales) 16,5% 9,5% 4,3% 16,6% 11,6% 4,3% 11,8% 4,3% 16,6% 11,0% 4,5% 16,6% 11,0% 4,5% 16,6% 11,0% 4,5% 16,6% 11,0% 4,5% 16,6% 11,0% 4,5% 0,5% 0,9% 3,6% 0,1% 2,2% 0,4% 2,5% 0,5% 2,7% 0,5% 2,7% 0,5% 2,7% 0,5% 2,7% 2,7% PP&E Schedule (U.S. S thousands) 2017A 2018A 2019A 2020E 2021E 2022E 2023E 2024E 5,1% Depreciation (% Sales) CapEx (% Sales) 4,8% 7,8% 5,5% 8,1% 5,1% 8,5% 5,1% 8,1% 5,1% 8,1% 5,1% 8,1% 5,1% 8,1% 8,1% Financing Schedule (U.S. S thousands) 2017A 2018A 2019A 2020E 2021E 2022E 2023E 2024E 90 10 10 10 10 Objective Balance of Bank loans Interest rate as % of beginning balance 340,6 5,5% 340,6 5,5% 310,6 5,5% 5,5% 5,5% 5,5% 5,5% 5,5% Sunshine Consolidated Balance Sheets (Actual), 2017-2019 (Fiscal years ending December 31; U.S. S000s) 2017A 2018A 2019A 2020E 2021E 2022E 2023E 2024E Cash and equivalents Accounts receivable Inventory Prepaid expenses Current assets 379,1 485,9 279,8 27,8 1.172,5 350,2 592,0 413,7 5,2 1.361,1 359,8 680,1 480,6 16,9 1.537,4 Net PP&E Total assets 249,1 1.421,6 339,3 1.700,3 479,8 2.017,1 340,6 340,6 Bank loans Accounts payable Accrued expenses Total Liabilities 126,6 104,9 572,1 153,4 77,0 570,9 310,6 175,1 101,8 587,5 Shareholders' equity Total liabilities and equity 849,5 1.421,6 1.129,4 1.700,3 1.429,6 2.017,1 Sunshine Consolidated Income Statements (Actual), 2017-2019 (Fiscal years ending December 31; U.S. S000s) 2017A 2018A 2019A 2020E 2021E 2022E 2023E 2024E Net sales COGS Gross profit 2.944,9 1.525,0 1.420,0 3.566,3 1.811,7 1.754,6 4.072,7 2.085,2 1.987,5 814,9 153,1 SG&A expense R&D expense Depreciation and amortization Interest expense Pretax income (loss) 930,1 178,3 196,9 18,7 142,2 1.080,9 219,9 206,1 18,7 461,8 18,7 291,0 430,6 101,8 150,7 Income taxes Net income 161,6 300,2 189,1 279,9 1.100 1.100 1.100 Number of common shares (thousands) Earnings per share Cash dividend per share 0,25 0,27 0,17 0,0 0,0 0,0 1.100 1.100 1.100 Number of common shares (thousands) Earnings per share Cash dividend per share 0,17 0,25 0,0 0,27 0,0 0,0 Sunshine Consolidated Statement of Cash Flows (Actual), 2017-2019 (Fiscal years ending December 31; U.S. S000s) 2017A 2018A 2019A 2020E 2021E 2022E 2023E 2024E Operating Activities Net income Depreciation and amortization Less: increase (decrease) in accounts receivable Less: increase (decrease) in inventory Less: increase (decrease) in prepaid expenses Add: increase (decrease) in accounts payable Add: increase (decrease) in accrued expenses Operating activities - net cash flow 189,1 142,2 9,0 (108,5) (28,0) 35,0 14,0 279,9 196,9 106,1 133,9 (22,6) 26,7 (27,9) 258,2 300,2 206,1 88,1 66,9 11,7 21,8 24,8 386,1 507,9 Investing Activities Less: capex Investing activities - net cash flow (230,3) (230,3) (287,1) (287,1) (346,6) (346,6) Financing Activities Add: debt net issuance Add: net issuance of common stock Less: cash dividend Financing activities - net cash flow (100,0) 0,0 0,0 (100,0) 0,0 0,0 0,0 0,0 (30,0) 0,0 0,0 (30,0) Total net cash flow 177,6 (28,9) 9,6 Beginning cash Change in cash Ending cash 201,5 177,6 379,1 379,1 (28,9) 350,2 350,2 9,6 359,8 Please use your analysis in Q1 to estimate the free cash flows and perform the DCF valuation per share for the Sunshine company. Please perform the analysis on this worksheet only, with the fomular link to the cells in the worksheet of Q1. Assumptions: WACC Tax rate Perpetual growth rate Number of common shares (thousands) 9,0% 35% 3,5% 1.100 2017A 2018A 2019A 2020E 2021E 2022E 2023E 2024E EBIT Less: taxes NOPAT Add: depreciation and amortization Less: capital expenditures Less change in net working capital and deferred taxes Unlevered free cash flow PV (unlevered free cash flow) Total PV (UFCF) Terminal value PV terminal value Enterprise value Less: debt Add: cash Implied equity value Shares outstanding Implied share price If Sunshine requires 10 times of 2016 EBITDA as the selling price, would you vote for this acquisition plan? Explain why or why not. Wonder company is evaluating an acquisition opportunity. The target firm Sunshine provides the Wonder company an opportunity to pursue the growth strategy. Although Sunshine is very attrative, it is however not operated efficiency. Wonder would have the chance to improve its operation after the acquisition. Before estimating free cash flows for the DCF valuation, we need to estimate the projected financial statements first. The following information is the Wonder's projected performane on Sunshine. Please use these information to complete the pro forma statements (at least Income Statement and Balance Sheet) for the Sunshine company. Please use the equation to estimate all numbers. You can use any space on the right hand side for extra calculation if needed. Assumptions for Consolidated Income Statements 2017A 2018A 2019A 2020E 2021E 2022E 2023E 2024E 21,1% 14,2% 24,0% 17,5% 15,0% 12,0% 10,0% Revenue growth Items as a % of Revenue COGS SG&A expense R&D expense Tax rate 51,2% 26,5% 51,8% 27,7% 5,2% 35,0% 50,8% 26,1% 5,0% 35,0% 49,0% 23,9% 5,2% 35,0% 49,0% 23,9% 5,2% 35,0% 49,0% 23,9% 5,2% 35,0% 49,0% 23,9% 5,2% 35,0% 49,0% 23,9% 5,2% 35,0% 5,4% 35,0% Assumptions Used for Consolidated Balance Sheets Working Capital Assumptions (U.S. $ thousands) 2017A 2018A 2019A 2020E 2021E 2022E 2023E 2024E 16,7% Working Capital Ratios Accounts receivable % Sales) Inventory (% Sales) Accounts payable (% Sales) Other Activity Ratios Prepaid Expenses (% Sales) Accrued Expenses (% Sales) 16,5% 9,5% 4,3% 16,6% 11,6% 4,3% 11,8% 4,3% 16,6% 11,0% 4,5% 16,6% 11,0% 4,5% 16,6% 11,0% 4,5% 16,6% 11,0% 4,5% 16,6% 11,0% 4,5% 0,5% 0,9% 3,6% 0,1% 2,2% 0,4% 2,5% 0,5% 2,7% 0,5% 2,7% 0,5% 2,7% 0,5% 2,7% 2,7% PP&E Schedule (U.S. S thousands) 2017A 2018A 2019A 2020E 2021E 2022E 2023E 2024E 5,1% Depreciation (% Sales) CapEx (% Sales) 4,8% 7,8% 5,5% 8,1% 5,1% 8,5% 5,1% 8,1% 5,1% 8,1% 5,1% 8,1% 5,1% 8,1% 8,1% Financing Schedule (U.S. S thousands) 2017A 2018A 2019A 2020E 2021E 2022E 2023E 2024E 90 10 10 10 10 Objective Balance of Bank loans Interest rate as % of beginning balance 340,6 5,5% 340,6 5,5% 310,6 5,5% 5,5% 5,5% 5,5% 5,5% 5,5% Sunshine Consolidated Balance Sheets (Actual), 2017-2019 (Fiscal years ending December 31; U.S. S000s) 2017A 2018A 2019A 2020E 2021E 2022E 2023E 2024E Cash and equivalents Accounts receivable Inventory Prepaid expenses Current assets 379,1 485,9 279,8 27,8 1.172,5 350,2 592,0 413,7 5,2 1.361,1 359,8 680,1 480,6 16,9 1.537,4 Net PP&E Total assets 249,1 1.421,6 339,3 1.700,3 479,8 2.017,1 340,6 340,6 Bank loans Accounts payable Accrued expenses Total Liabilities 126,6 104,9 572,1 153,4 77,0 570,9 310,6 175,1 101,8 587,5 Shareholders' equity Total liabilities and equity 849,5 1.421,6 1.129,4 1.700,3 1.429,6 2.017,1 Sunshine Consolidated Income Statements (Actual), 2017-2019 (Fiscal years ending December 31; U.S. S000s) 2017A 2018A 2019A 2020E 2021E 2022E 2023E 2024E Net sales COGS Gross profit 2.944,9 1.525,0 1.420,0 3.566,3 1.811,7 1.754,6 4.072,7 2.085,2 1.987,5 814,9 153,1 SG&A expense R&D expense Depreciation and amortization Interest expense Pretax income (loss) 930,1 178,3 196,9 18,7 142,2 1.080,9 219,9 206,1 18,7 461,8 18,7 291,0 430,6 101,8 150,7 Income taxes Net income 161,6 300,2 189,1 279,9 1.100 1.100 1.100 Number of common shares (thousands) Earnings per share Cash dividend per share 0,25 0,27 0,17 0,0 0,0 0,0 1.100 1.100 1.100 Number of common shares (thousands) Earnings per share Cash dividend per share 0,17 0,25 0,0 0,27 0,0 0,0 Sunshine Consolidated Statement of Cash Flows (Actual), 2017-2019 (Fiscal years ending December 31; U.S. S000s) 2017A 2018A 2019A 2020E 2021E 2022E 2023E 2024E Operating Activities Net income Depreciation and amortization Less: increase (decrease) in accounts receivable Less: increase (decrease) in inventory Less: increase (decrease) in prepaid expenses Add: increase (decrease) in accounts payable Add: increase (decrease) in accrued expenses Operating activities - net cash flow 189,1 142,2 9,0 (108,5) (28,0) 35,0 14,0 279,9 196,9 106,1 133,9 (22,6) 26,7 (27,9) 258,2 300,2 206,1 88,1 66,9 11,7 21,8 24,8 386,1 507,9 Investing Activities Less: capex Investing activities - net cash flow (230,3) (230,3) (287,1) (287,1) (346,6) (346,6) Financing Activities Add: debt net issuance Add: net issuance of common stock Less: cash dividend Financing activities - net cash flow (100,0) 0,0 0,0 (100,0) 0,0 0,0 0,0 0,0 (30,0) 0,0 0,0 (30,0) Total net cash flow 177,6 (28,9) 9,6 Beginning cash Change in cash Ending cash 201,5 177,6 379,1 379,1 (28,9) 350,2 350,2 9,6 359,8 Please use your analysis in Q1 to estimate the free cash flows and perform the DCF valuation per share for the Sunshine company. Please perform the analysis on this worksheet only, with the fomular link to the cells in the worksheet of Q1. Assumptions: WACC Tax rate Perpetual growth rate Number of common shares (thousands) 9,0% 35% 3,5% 1.100 2017A 2018A 2019A 2020E 2021E 2022E 2023E 2024E EBIT Less: taxes NOPAT Add: depreciation and amortization Less: capital expenditures Less change in net working capital and deferred taxes Unlevered free cash flow PV (unlevered free cash flow) Total PV (UFCF) Terminal value PV terminal value Enterprise value Less: debt Add: cash Implied equity value Shares outstanding Implied share price If Sunshine requires 10 times of 2016 EBITDA as the selling price, would you vote for this acquisition plan? Explain why or why not


