Urgent pls. Need all answers
Financial Statement Analysis You are the personal investment advisor of Mr. Wolverine and have been asked to prepare an analysis on two companies (please see a separate list of companies) where he is willing to invest. You are required to provide a written report to him based on your analysis of the financial data (last 3 years, FY2017- FY2019) from the annual report and the available market data. You may access the annual reports from the companys website and the market information from Dhaka Stock Exchange website. Your report should include ratio analysis for:
(a) Profitability
(b) Activity/Asset Management
(c) Liquidity
(d) Debt Management & Market Value
Data is given below:
Envoytex:

Malekspin:

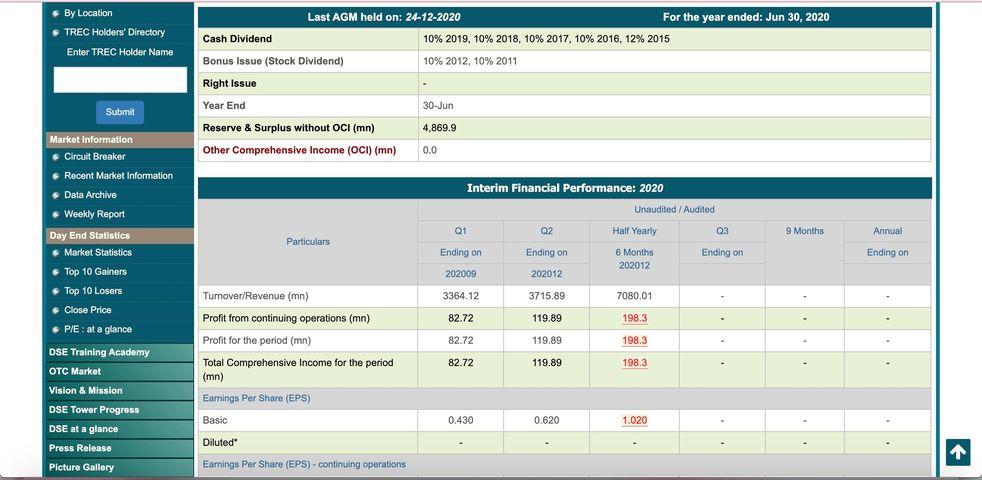
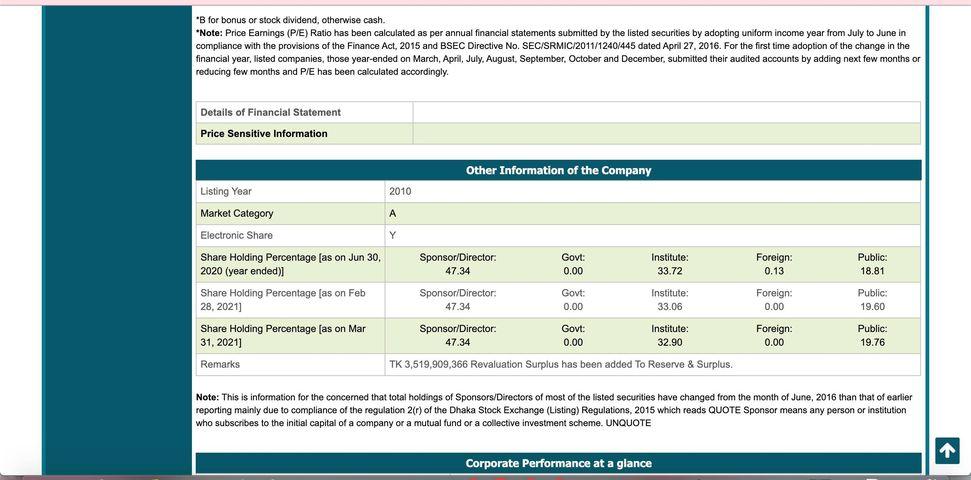
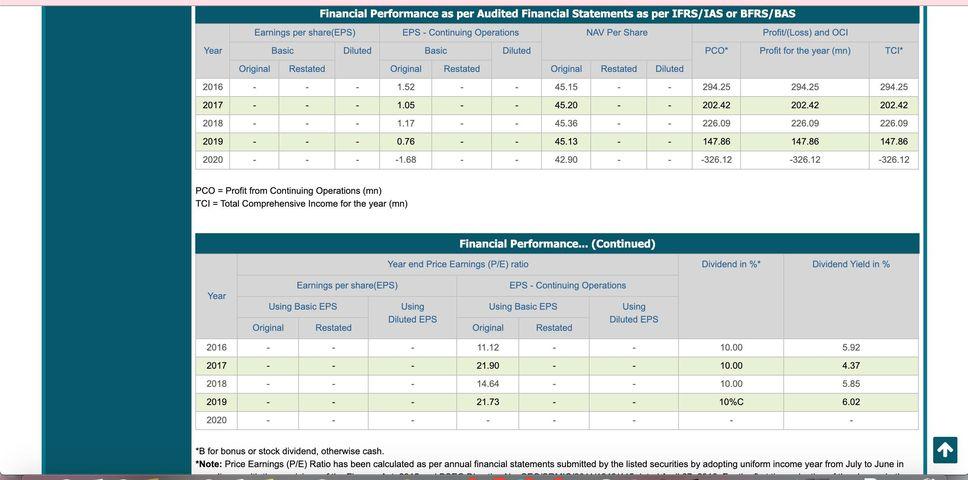
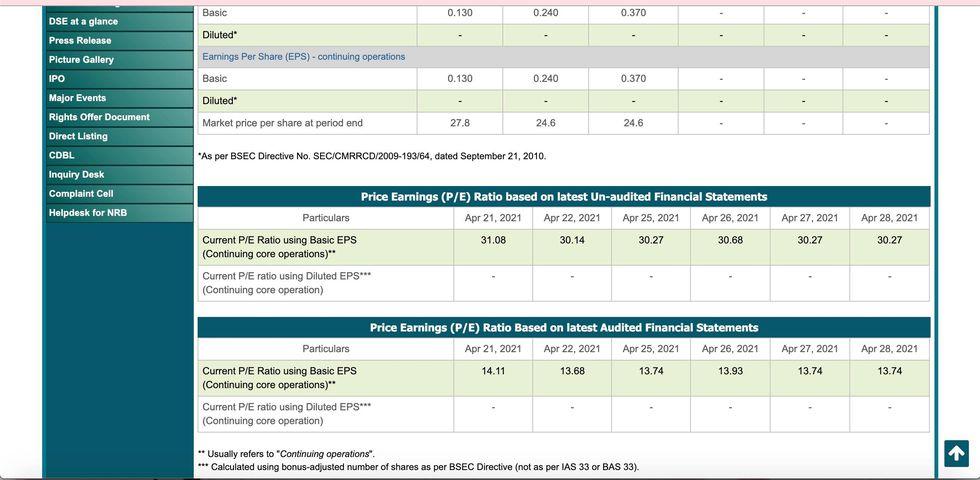
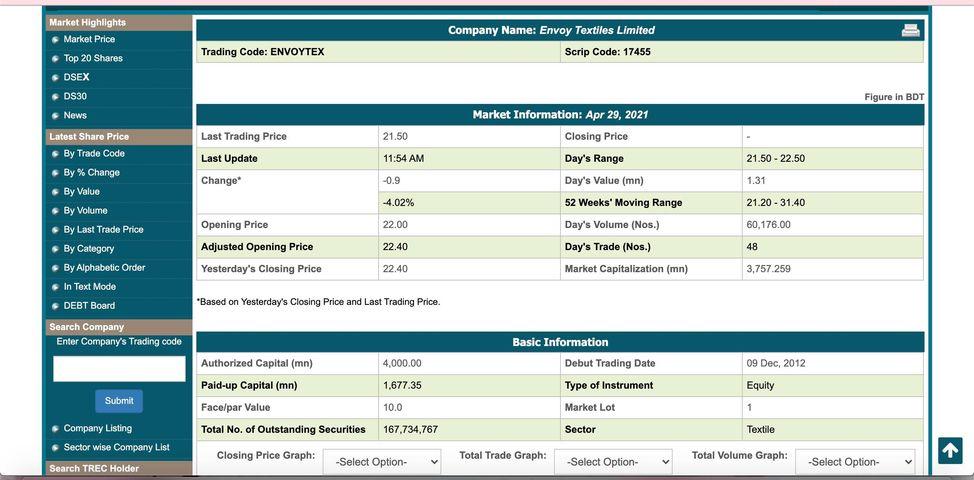
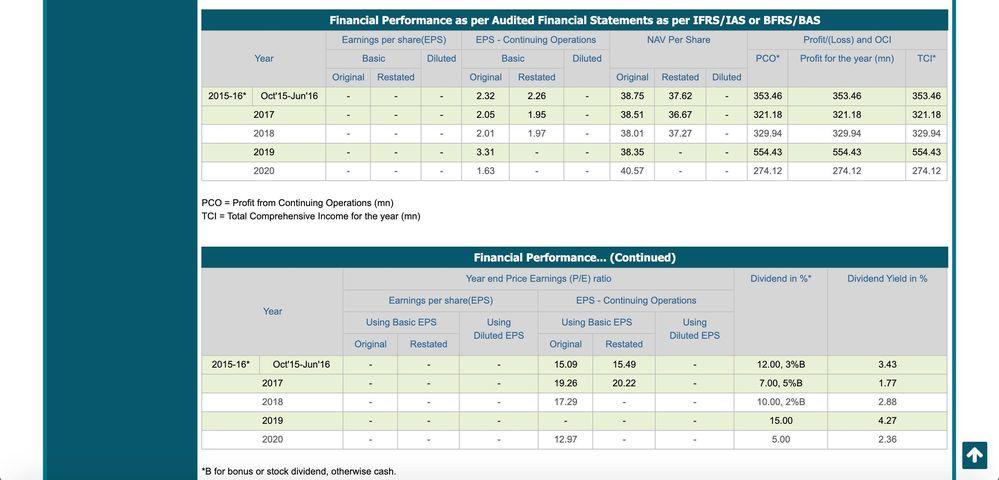
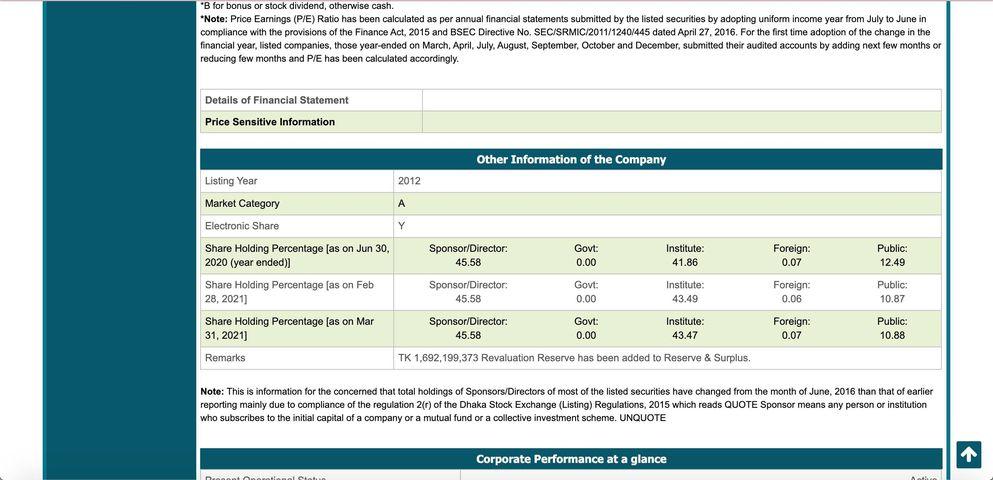
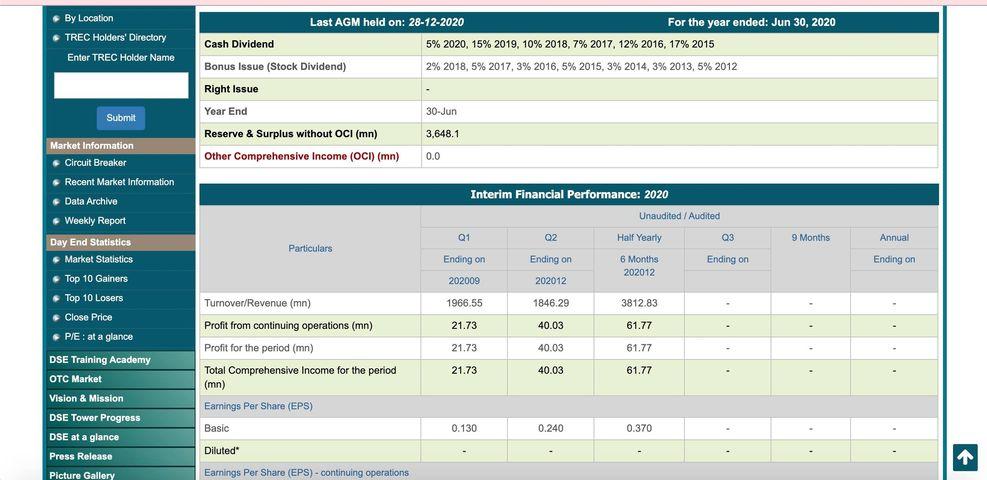
Company Name: Envoy Textiles Limited Scrip Code: 17455 Trading Code: ENVOYTEX Market Highlights Market Price Top 20 Shares s DSEX DS30 News Figure in BDT 21.50 Last Trading Price Last Update Change 11:54 AM 21.50 - 22.50 -0.9 1.31 -4.02% Market Information: Apr 29, 2021 Closing Price Day's Range Day's Value (mn) 52 Weeks' Moving Range Day's Volume (Nos.) Day's Trade (Nos.) Market Capitalization (mn) ( 21.20 - 31.40 22.00 Latest Share Price By Trade Code By % Change By Value By Volume By Last Trade Price By Category By Alphabetic Order In Text Mode DEBT Board Search Company Enter Company's Trading code 60,176.00 Opening Price Adjusted Opening Price Yesterday's Closing Price 22.40 48 22.40 3,757.259 Based on Yesterday's Closing Price and Last Trading Price Basic Information Authorized Capital (mn) 4,000.00 09 Dec, 2012 1,677.35 Debut Trading Date Type of Instrument Market Lot Equity Paid-up Capital (mn) Face/par Value Total No. of Outstanding Securities Submit 10.0 1 167,734,767 Sector Textile Company Listing Sector wise Company List Search TREC Holder Closing Price Graph: Total Trade Graph: Total Volume Graph: -Select Option- Select Option- -Select Option- Basic 0.130 0.240 0.370 DSE at a glance Diluted - Earnings Per Share (EPS) - continuing operations Basic 0.130 0.240 0.370 Press Release Picture Gallery IPO Major Events Rights Offer Document Direct Listing CDBL Diluted" - Market price per share at period end 27.8 24.6 24.6 "As per BSEC Directive No. SEC/CMRRCD/2009-193/64, dated September 21, 2010 Inquiry Desk Complaint Cell Helpdesk for NRB Apr 27, 2021 Apr 28, 2021 Price Earnings (P/E) Ratio based on latest Un-audited Financial Statements Particulars Apr 21, 2021 Apr 22, 2021 Apr 25, 2021 Apr 26, 2021 Current P/E Ratio using Basic EPS 31.08 30.14 30.27 30.68 (Continuing core operations)" Current P/E ratio using Diluted EPS*** (Continuing core operation) 30.27 30.27 Particulars Apr 27, 2021 Apr 28, 2021 13.74 Price Earnings (P/E) Ratio Based on latest Audited Financial Statements Apr 21, 2021 Apr 22, 2021 Apr 25, 2021 Apr 26, 2021 Current P/E Ratio using Basic EPS 14.11 13.68 13.74 13.93 (Continuing core operations)" Current P/E ratio using Diluted EPS*** (Continuing core operation) 13.74 1 ** Usually refers to "Continuing operations". *** Calculated using bonus-adjusted number of shares as per BSEC Directive (not as per IAS 33 or BAS 33). Company Name: Envoy Textiles Limited Scrip Code: 17455 Trading Code: ENVOYTEX Market Highlights Market Price Top 20 Shares s DSEX DS30 News Figure in BDT 21.50 Last Trading Price Last Update Change 11:54 AM 21.50 - 22.50 -0.9 1.31 -4.02% Market Information: Apr 29, 2021 Closing Price Day's Range Day's Value (mn) 52 Weeks' Moving Range Day's Volume (Nos.) Day's Trade (Nos.) Market Capitalization (mn) ( 21.20 - 31.40 22.00 Latest Share Price By Trade Code By % Change By Value By Volume By Last Trade Price By Category By Alphabetic Order In Text Mode DEBT Board Search Company Enter Company's Trading code 60,176.00 Opening Price Adjusted Opening Price Yesterday's Closing Price 22.40 48 22.40 3,757.259 Based on Yesterday's Closing Price and Last Trading Price Basic Information Authorized Capital (mn) 4,000.00 09 Dec, 2012 1,677.35 Debut Trading Date Type of Instrument Market Lot Equity Paid-up Capital (mn) Face/par Value Total No. of Outstanding Securities Submit 10.0 1 167,734,767 Sector Textile Company Listing Sector wise Company List Search TREC Holder Closing Price Graph: Total Trade Graph: Total Volume Graph: -Select Option- Select Option- -Select Option- Year TCI 2015-16 Oct'15-Jun'16 Financial Performance as per Audited Financial Statements as per IFRS/IAS or BFRS/BAS Earnings per share(EPS) EPS - Continuing Operations NAV Per Share Profit(Loss) and OCI Basic Diluted Basic Diluted PCO" Profit for the year (mn) Original Restated Original Restated Original Restated Diluted 2.32 2.26 38.75 37.62 353,46 353.46 2.05 1.95 38.51 36.67 321.18 321.18 2.01 1.97 38.01 37.27 329.94 329.94 3.31 38.35 554.43 554.43 1.63 40.57 274.12 274.12 353.46 321.18 2017 - 2018 329.94 2019 554.43 274.12 2020 PCO = Profit from Continuing Operations (mn) TCI = Total Comprehensive Income for the year (mn) Dividend in % Dividend Yield in % Year Financial Performance... (Continued) Year end Price Earnings (P/E) ratio Earnings per share(EPS) EPS - Continuing Operations - Using Basic EPS Using Using Basic EPS Using Diluted EPS Diluted EPS Original Restated Original Restated 15.09 15.49 2015-16 Oct 15-Jun'16 - . - 3.43 12.00, 3%B 7.00, 5%B 2017 - 19.26 20.22 1.77 2018 - 17.29 2.88 10.00,2%B 15.00 4.27 2019 2020 - 12.97 5.00 2.36 *B for bonus or stock dividend, otherwise cash. "B for bonus or stock dividend, otherwise cash. Note: Price Earnings (PE) Ratio has been calculated as per annual financial statements submitted by the listed securities by adopting uniform income year from July to June in compliance with the provisions of the Finance Act, 2015 and BSEC Directive No. SECISRMIC/2011/12401445 dated April 27, 2016. For the first time adoption of the change in the financial year, listed companies, those year-ended on March April, July, August, September October and December, submitted their audited accounts by adding next few months or reducing few months and P/E has been calculated accordingly. Details of Financial Statement Price Sensitive Information Other Information of the Company Listing Year 2012 Market Category A Electronic Share Y Sponsor/Director: 45.58 Govt: 0.00 Institute: 41.86 Foreign: 0.07 Public: 12.49 Share Holding Percentage [as on Jun 30, 2020 (year ended)] Share Holding Percentage [as on Feb 28, 2021) Share Holding Percentage [as on Mar 31, 2021] Sponsor/Director: 45.58 Govt: 0.00 Institute 43.49 Foreign: 0.06 Public: 10.87 Sponsor/Director: 45.58 Govt: 0.00 Institute: 43.47 Foreign: 0.07 Public: 10.88 Remarks TK 1,692, 199,373 Revaluation Reserve has been added to Reserve & Surplus. Note: This is information for the concerned that total holdings of Sponsors/Directors of most of the listed securities have changed from the month of June, 2016 than that of earlier reporting mainly due to compliance of the regulation 2() of the Dhaka Stock Exchange (Listing) Regulations, 2015 which reads QUOTE Sponsor means any person or institution who subscribe to the initial capital of a company or a mutual fund or a collective investment scheme. UNQUOTE Corporate Performance at a glance 00 alati By Location TREC Holders' Directory Enter TREC Holder Name Last AGM held on: 28-12-2020 : For the year ended: Jun 30, 2020 5% 2020,15% 2019, 10% 2018, 7% 2017, 12% 2016, 17% 2015 Cash Dividend 2% 2018,5% 2017,3% 2016, 5% 2015,3% 2014, 3% 2013, 5% 2012 Submit Bonus Issue (Stock Dividend) Right Issue Year End Reserve & Surplus without OCI (mn) Other Comprehensive Income (OCI) (mn) 30-Jun 3,648.1 0.0 Interim Financial Performance: 2020 Unaudited / Audited Q1 Q2 Half Yearly @3 9 Months Annual Particulars Ending on Ending on 6 Months 202012 Ending on Ending on 202009 202012 Turnover/Revenue (mn) 1966.55 1846.29 Market Information Circuit Breaker Recent Market Information Data Archive Weekly Report Day End Statistics Market Statistics Top 10 Gainers Top 10 Losers Close Price P/E: at a glance DSE Training Academy OTC Market Vision & Mission DSE Tower Progress DSE at a glance Press Release Picture Gallery 3812.83 Profit from continuing operations (mn) 21.73 40.03 61.77 Profit for the period (mn) 21.73 40.03 61.77 21.73 40.03 61.77 Total Comprehensive Income for the period (mn) Earnings Per Share (EPS) Basic 0.130 0.240 0.370 Diluted - - 1 Earnings Per Share (EPS) - continuing operations Basic 0.130 0.240 0.370 DSE at a glance Diluted - Earnings Per Share (EPS) - continuing operations Basic 0.130 0.240 0.370 Press Release Picture Gallery IPO Major Events Rights Offer Document Direct Listing CDBL Diluted" - Market price per share at period end 27.8 24.6 24.6 "As per BSEC Directive No. SEC/CMRRCD/2009-193/64, dated September 21, 2010 Inquiry Desk Complaint Cell Helpdesk for NRB Apr 27, 2021 Apr 28, 2021 Price Earnings (P/E) Ratio based on latest Un-audited Financial Statements Particulars Apr 21, 2021 Apr 22, 2021 Apr 25, 2021 Apr 26, 2021 Current P/E Ratio using Basic EPS 31.08 30.14 30.27 30.68 (Continuing core operations)" Current P/E ratio using Diluted EPS*** (Continuing core operation) 30.27 30.27 Particulars Apr 27, 2021 Apr 28, 2021 13.74 Price Earnings (P/E) Ratio Based on latest Audited Financial Statements Apr 21, 2021 Apr 22, 2021 Apr 25, 2021 Apr 26, 2021 Current P/E Ratio using Basic EPS 14.11 13.68 13.74 13.93 (Continuing core operations)" Current P/E ratio using Diluted EPS*** (Continuing core operation) 13.74 1 ** Usually refers to "Continuing operations". *** Calculated using bonus-adjusted number of shares as per BSEC Directive (not as per IAS 33 or BAS 33). By Location TREC Holders' Directory ' Enter TREC Holder Name Last AGM held on: 24-12-2020 For the year ended: Jun 30, 2020 Cash Dividend 10% 2019, 10% 2018, 10% 2017, 10% 2016, 12% 2015 Bonus Issue (Stock Dividend) 10% 2012, 10% 2011 Right Issue Year End 30-Jun Submit 4,869.9 Reserve & Surplus without OCI (mn) Other Comprehensive Income (OCI) (mn) 0.0 Market Information Circuit Breaker Recent Market Information Data Archive Weekly Report Interim Financial Performance: 2020 Unaudited/Audited 01 02 Half Yearty Q3 9 Months Annual Particulars Ending on Ending on Ending on Ending on 6 Months 202012 202009 202012 Day End Statistics Market Statistics Top 10 Gainers Top 10 Losers Close Price P/E: at a glance 3364.12 3715.89 7080.01 82.72 119.89 198.3 Turnover/Revenue (mn) Profit from continuing operations (mn) Profit for the period (mn) Total Comprehensive Income for the period (mn) 82.72 119.89 198.3 82.72 119.89 198.3 Earings Per Share (EPS) DSE Training Academy OTC Market Vision & Mission & DSE Tower Progress DSE at a glance Press Release Picture Gallery Basic 0.430 0.620 1.020 Diluted" Earnings Per Share (EPS) - continuing operations "B for bonus or stock dividend, otherwise cash. Note: Price Earnings (P/E) Ratio has been calculated as per annual financial statements submitted by the listed securities by adopting uniform income year from July to June in compliance with the provisions of the Finance Act, 2015 and BSEC Directive No. SEC/SRMIC/2011/1240/445 dated April 27, 2016. For the first time adoption of the change in the financial year, listed companies, those year-ended on March, April, July, August, September October and December, submitted their audited accounts by adding next few months or reducing few months and P/E has been calculated accordingly. Details of Financial Statement Price Sensitive Information Other Information of the Company Listing Year 2010 Market Category A Electronic Share Y Govt Sponsor/Director: 47.34 Institute: 33.72 Foreign: 0.13 Public: 18.81 0.00 Share Holding Percentage [as on Jun 30, 2020 (year ended)] Share Holding Percentage [as on Feb 28, 2021) Share Holding Percentage (as on Mar 31, 2021) Sponsor/Director: 47.34 Govt: 0.00 Institute: 33.06 Foreign 0.00 Public: 19.60 Sponsor/Director: 47.34 Govt: 0.00 Institute: 32.90 Foreign 0.00 Public: 19.76 Remarks TK 3,519,909,366 Revaluation Surplus has been added To Reserve & Surplus. Note: This is information for the concemed that total holdings of Sponsors/Directors of most of the listed securities have changed from the month of June, 2016 than that of earlier reporting mainly due to compliance of the regulation 2(r) of the Dhaka Stock Exchange (Listing) Regulations, 2015 which reads QUOTE Sponsor means any person or institution who subscribes to the initial capital of a company or a mutual fund or a collective investment scheme. UNQUOTE 1 Corporate Performance at a glance Year TCI" 2016 Financial Performance as per Audited Financial Statements as per IFRS/IAS or BFRS/BAS Earnings per share(EPS) EPS - Continuing Operations NAV Per Share Profit(Loss) and OCI Basic Diluted Basic Diluted PCO Profit for the year (mn) Original Restated Original Restated Original Restated Diluted 1.52 - 45.15 294.25 294.25 - 1.05 45.20 202.42 202.42 - 1.17 45.36 226.09 226.09 - 0.76 45.13 147.86 147.86 -1.68 42.90 -326.12 -326.12 294,25 2017 202.42 2018 226.09 2019 147.86 2020 -326.12 PCO = Profit from Continuing Operations (mn) TCI = Total Comprehensive Income for the year (mn) Dividend in % Dividend Yield in % Financial Performance... (Continued) Year end Price Earnings (P/E) ratio Earnings per share(EPS) EPS - Continuing Operations Using Basic EPS Using Using Basic EPS Using Diluted EPS Diluted EPS Original Restated Original Restated Year 2016 . 11.12 10.00 5.92 4.37 2017 21.90 10.00 2018 14.64 10.00 5.85 - 21.73 - 10%C 6.02 2019 2020 B for bonus or stock dividend, otherwise cash. *Note: Price Earnings (P/E) Ratio has been calculated as per annual financial statements submitted by the listed securities by adopting uniform income year from July to June in ID Company Name: Envoy Textiles Limited Scrip Code: 17455 Trading Code: ENVOYTEX Market Highlights Market Price Top 20 Shares s DSEX DS30 News Figure in BDT 21.50 Last Trading Price Last Update Change 11:54 AM 21.50 - 22.50 -0.9 1.31 -4.02% Market Information: Apr 29, 2021 Closing Price Day's Range Day's Value (mn) 52 Weeks' Moving Range Day's Volume (Nos.) Day's Trade (Nos.) Market Capitalization (mn) ( 21.20 - 31.40 22.00 Latest Share Price By Trade Code By % Change By Value By Volume By Last Trade Price By Category By Alphabetic Order In Text Mode DEBT Board Search Company Enter Company's Trading code 60,176.00 Opening Price Adjusted Opening Price Yesterday's Closing Price 22.40 48 22.40 3,757.259 Based on Yesterday's Closing Price and Last Trading Price Basic Information Authorized Capital (mn) 4,000.00 09 Dec, 2012 1,677.35 Debut Trading Date Type of Instrument Market Lot Equity Paid-up Capital (mn) Face/par Value Total No. of Outstanding Securities Submit 10.0 1 167,734,767 Sector Textile Company Listing Sector wise Company List Search TREC Holder Closing Price Graph: Total Trade Graph: Total Volume Graph: -Select Option- Select Option- -Select Option- Basic 0.130 0.240 0.370 DSE at a glance Diluted - Earnings Per Share (EPS) - continuing operations Basic 0.130 0.240 0.370 Press Release Picture Gallery IPO Major Events Rights Offer Document Direct Listing CDBL Diluted" - Market price per share at period end 27.8 24.6 24.6 "As per BSEC Directive No. SEC/CMRRCD/2009-193/64, dated September 21, 2010 Inquiry Desk Complaint Cell Helpdesk for NRB Apr 27, 2021 Apr 28, 2021 Price Earnings (P/E) Ratio based on latest Un-audited Financial Statements Particulars Apr 21, 2021 Apr 22, 2021 Apr 25, 2021 Apr 26, 2021 Current P/E Ratio using Basic EPS 31.08 30.14 30.27 30.68 (Continuing core operations)" Current P/E ratio using Diluted EPS*** (Continuing core operation) 30.27 30.27 Particulars Apr 27, 2021 Apr 28, 2021 13.74 Price Earnings (P/E) Ratio Based on latest Audited Financial Statements Apr 21, 2021 Apr 22, 2021 Apr 25, 2021 Apr 26, 2021 Current P/E Ratio using Basic EPS 14.11 13.68 13.74 13.93 (Continuing core operations)" Current P/E ratio using Diluted EPS*** (Continuing core operation) 13.74 1 ** Usually refers to "Continuing operations". *** Calculated using bonus-adjusted number of shares as per BSEC Directive (not as per IAS 33 or BAS 33). Company Name: Envoy Textiles Limited Scrip Code: 17455 Trading Code: ENVOYTEX Market Highlights Market Price Top 20 Shares s DSEX DS30 News Figure in BDT 21.50 Last Trading Price Last Update Change 11:54 AM 21.50 - 22.50 -0.9 1.31 -4.02% Market Information: Apr 29, 2021 Closing Price Day's Range Day's Value (mn) 52 Weeks' Moving Range Day's Volume (Nos.) Day's Trade (Nos.) Market Capitalization (mn) ( 21.20 - 31.40 22.00 Latest Share Price By Trade Code By % Change By Value By Volume By Last Trade Price By Category By Alphabetic Order In Text Mode DEBT Board Search Company Enter Company's Trading code 60,176.00 Opening Price Adjusted Opening Price Yesterday's Closing Price 22.40 48 22.40 3,757.259 Based on Yesterday's Closing Price and Last Trading Price Basic Information Authorized Capital (mn) 4,000.00 09 Dec, 2012 1,677.35 Debut Trading Date Type of Instrument Market Lot Equity Paid-up Capital (mn) Face/par Value Total No. of Outstanding Securities Submit 10.0 1 167,734,767 Sector Textile Company Listing Sector wise Company List Search TREC Holder Closing Price Graph: Total Trade Graph: Total Volume Graph: -Select Option- Select Option- -Select Option- Year TCI 2015-16 Oct'15-Jun'16 Financial Performance as per Audited Financial Statements as per IFRS/IAS or BFRS/BAS Earnings per share(EPS) EPS - Continuing Operations NAV Per Share Profit(Loss) and OCI Basic Diluted Basic Diluted PCO" Profit for the year (mn) Original Restated Original Restated Original Restated Diluted 2.32 2.26 38.75 37.62 353,46 353.46 2.05 1.95 38.51 36.67 321.18 321.18 2.01 1.97 38.01 37.27 329.94 329.94 3.31 38.35 554.43 554.43 1.63 40.57 274.12 274.12 353.46 321.18 2017 - 2018 329.94 2019 554.43 274.12 2020 PCO = Profit from Continuing Operations (mn) TCI = Total Comprehensive Income for the year (mn) Dividend in % Dividend Yield in % Year Financial Performance... (Continued) Year end Price Earnings (P/E) ratio Earnings per share(EPS) EPS - Continuing Operations - Using Basic EPS Using Using Basic EPS Using Diluted EPS Diluted EPS Original Restated Original Restated 15.09 15.49 2015-16 Oct 15-Jun'16 - . - 3.43 12.00, 3%B 7.00, 5%B 2017 - 19.26 20.22 1.77 2018 - 17.29 2.88 10.00,2%B 15.00 4.27 2019 2020 - 12.97 5.00 2.36 *B for bonus or stock dividend, otherwise cash. "B for bonus or stock dividend, otherwise cash. Note: Price Earnings (PE) Ratio has been calculated as per annual financial statements submitted by the listed securities by adopting uniform income year from July to June in compliance with the provisions of the Finance Act, 2015 and BSEC Directive No. SECISRMIC/2011/12401445 dated April 27, 2016. For the first time adoption of the change in the financial year, listed companies, those year-ended on March April, July, August, September October and December, submitted their audited accounts by adding next few months or reducing few months and P/E has been calculated accordingly. Details of Financial Statement Price Sensitive Information Other Information of the Company Listing Year 2012 Market Category A Electronic Share Y Sponsor/Director: 45.58 Govt: 0.00 Institute: 41.86 Foreign: 0.07 Public: 12.49 Share Holding Percentage [as on Jun 30, 2020 (year ended)] Share Holding Percentage [as on Feb 28, 2021) Share Holding Percentage [as on Mar 31, 2021] Sponsor/Director: 45.58 Govt: 0.00 Institute 43.49 Foreign: 0.06 Public: 10.87 Sponsor/Director: 45.58 Govt: 0.00 Institute: 43.47 Foreign: 0.07 Public: 10.88 Remarks TK 1,692, 199,373 Revaluation Reserve has been added to Reserve & Surplus. Note: This is information for the concerned that total holdings of Sponsors/Directors of most of the listed securities have changed from the month of June, 2016 than that of earlier reporting mainly due to compliance of the regulation 2() of the Dhaka Stock Exchange (Listing) Regulations, 2015 which reads QUOTE Sponsor means any person or institution who subscribe to the initial capital of a company or a mutual fund or a collective investment scheme. UNQUOTE Corporate Performance at a glance 00 alati By Location TREC Holders' Directory Enter TREC Holder Name Last AGM held on: 28-12-2020 : For the year ended: Jun 30, 2020 5% 2020,15% 2019, 10% 2018, 7% 2017, 12% 2016, 17% 2015 Cash Dividend 2% 2018,5% 2017,3% 2016, 5% 2015,3% 2014, 3% 2013, 5% 2012 Submit Bonus Issue (Stock Dividend) Right Issue Year End Reserve & Surplus without OCI (mn) Other Comprehensive Income (OCI) (mn) 30-Jun 3,648.1 0.0 Interim Financial Performance: 2020 Unaudited / Audited Q1 Q2 Half Yearly @3 9 Months Annual Particulars Ending on Ending on 6 Months 202012 Ending on Ending on 202009 202012 Turnover/Revenue (mn) 1966.55 1846.29 Market Information Circuit Breaker Recent Market Information Data Archive Weekly Report Day End Statistics Market Statistics Top 10 Gainers Top 10 Losers Close Price P/E: at a glance DSE Training Academy OTC Market Vision & Mission DSE Tower Progress DSE at a glance Press Release Picture Gallery 3812.83 Profit from continuing operations (mn) 21.73 40.03 61.77 Profit for the period (mn) 21.73 40.03 61.77 21.73 40.03 61.77 Total Comprehensive Income for the period (mn) Earnings Per Share (EPS) Basic 0.130 0.240 0.370 Diluted - - 1 Earnings Per Share (EPS) - continuing operations Basic 0.130 0.240 0.370 DSE at a glance Diluted - Earnings Per Share (EPS) - continuing operations Basic 0.130 0.240 0.370 Press Release Picture Gallery IPO Major Events Rights Offer Document Direct Listing CDBL Diluted" - Market price per share at period end 27.8 24.6 24.6 "As per BSEC Directive No. SEC/CMRRCD/2009-193/64, dated September 21, 2010 Inquiry Desk Complaint Cell Helpdesk for NRB Apr 27, 2021 Apr 28, 2021 Price Earnings (P/E) Ratio based on latest Un-audited Financial Statements Particulars Apr 21, 2021 Apr 22, 2021 Apr 25, 2021 Apr 26, 2021 Current P/E Ratio using Basic EPS 31.08 30.14 30.27 30.68 (Continuing core operations)" Current P/E ratio using Diluted EPS*** (Continuing core operation) 30.27 30.27 Particulars Apr 27, 2021 Apr 28, 2021 13.74 Price Earnings (P/E) Ratio Based on latest Audited Financial Statements Apr 21, 2021 Apr 22, 2021 Apr 25, 2021 Apr 26, 2021 Current P/E Ratio using Basic EPS 14.11 13.68 13.74 13.93 (Continuing core operations)" Current P/E ratio using Diluted EPS*** (Continuing core operation) 13.74 1 ** Usually refers to "Continuing operations". *** Calculated using bonus-adjusted number of shares as per BSEC Directive (not as per IAS 33 or BAS 33). By Location TREC Holders' Directory ' Enter TREC Holder Name Last AGM held on: 24-12-2020 For the year ended: Jun 30, 2020 Cash Dividend 10% 2019, 10% 2018, 10% 2017, 10% 2016, 12% 2015 Bonus Issue (Stock Dividend) 10% 2012, 10% 2011 Right Issue Year End 30-Jun Submit 4,869.9 Reserve & Surplus without OCI (mn) Other Comprehensive Income (OCI) (mn) 0.0 Market Information Circuit Breaker Recent Market Information Data Archive Weekly Report Interim Financial Performance: 2020 Unaudited/Audited 01 02 Half Yearty Q3 9 Months Annual Particulars Ending on Ending on Ending on Ending on 6 Months 202012 202009 202012 Day End Statistics Market Statistics Top 10 Gainers Top 10 Losers Close Price P/E: at a glance 3364.12 3715.89 7080.01 82.72 119.89 198.3 Turnover/Revenue (mn) Profit from continuing operations (mn) Profit for the period (mn) Total Comprehensive Income for the period (mn) 82.72 119.89 198.3 82.72 119.89 198.3 Earings Per Share (EPS) DSE Training Academy OTC Market Vision & Mission & DSE Tower Progress DSE at a glance Press Release Picture Gallery Basic 0.430 0.620 1.020 Diluted" Earnings Per Share (EPS) - continuing operations "B for bonus or stock dividend, otherwise cash. Note: Price Earnings (P/E) Ratio has been calculated as per annual financial statements submitted by the listed securities by adopting uniform income year from July to June in compliance with the provisions of the Finance Act, 2015 and BSEC Directive No. SEC/SRMIC/2011/1240/445 dated April 27, 2016. For the first time adoption of the change in the financial year, listed companies, those year-ended on March, April, July, August, September October and December, submitted their audited accounts by adding next few months or reducing few months and P/E has been calculated accordingly. Details of Financial Statement Price Sensitive Information Other Information of the Company Listing Year 2010 Market Category A Electronic Share Y Govt Sponsor/Director: 47.34 Institute: 33.72 Foreign: 0.13 Public: 18.81 0.00 Share Holding Percentage [as on Jun 30, 2020 (year ended)] Share Holding Percentage [as on Feb 28, 2021) Share Holding Percentage (as on Mar 31, 2021) Sponsor/Director: 47.34 Govt: 0.00 Institute: 33.06 Foreign 0.00 Public: 19.60 Sponsor/Director: 47.34 Govt: 0.00 Institute: 32.90 Foreign 0.00 Public: 19.76 Remarks TK 3,519,909,366 Revaluation Surplus has been added To Reserve & Surplus. Note: This is information for the concemed that total holdings of Sponsors/Directors of most of the listed securities have changed from the month of June, 2016 than that of earlier reporting mainly due to compliance of the regulation 2(r) of the Dhaka Stock Exchange (Listing) Regulations, 2015 which reads QUOTE Sponsor means any person or institution who subscribes to the initial capital of a company or a mutual fund or a collective investment scheme. UNQUOTE 1 Corporate Performance at a glance Year TCI" 2016 Financial Performance as per Audited Financial Statements as per IFRS/IAS or BFRS/BAS Earnings per share(EPS) EPS - Continuing Operations NAV Per Share Profit(Loss) and OCI Basic Diluted Basic Diluted PCO Profit for the year (mn) Original Restated Original Restated Original Restated Diluted 1.52 - 45.15 294.25 294.25 - 1.05 45.20 202.42 202.42 - 1.17 45.36 226.09 226.09 - 0.76 45.13 147.86 147.86 -1.68 42.90 -326.12 -326.12 294,25 2017 202.42 2018 226.09 2019 147.86 2020 -326.12 PCO = Profit from Continuing Operations (mn) TCI = Total Comprehensive Income for the year (mn) Dividend in % Dividend Yield in % Financial Performance... (Continued) Year end Price Earnings (P/E) ratio Earnings per share(EPS) EPS - Continuing Operations Using Basic EPS Using Using Basic EPS Using Diluted EPS Diluted EPS Original Restated Original Restated Year 2016 . 11.12 10.00 5.92 4.37 2017 21.90 10.00 2018 14.64 10.00 5.85 - 21.73 - 10%C 6.02 2019 2020 B for bonus or stock dividend, otherwise cash. *Note: Price Earnings (P/E) Ratio has been calculated as per annual financial statements submitted by the listed securities by adopting uniform income year from July to June in ID