Answered step by step
Verified Expert Solution
Link Copied!

Question

1 Approved Answer

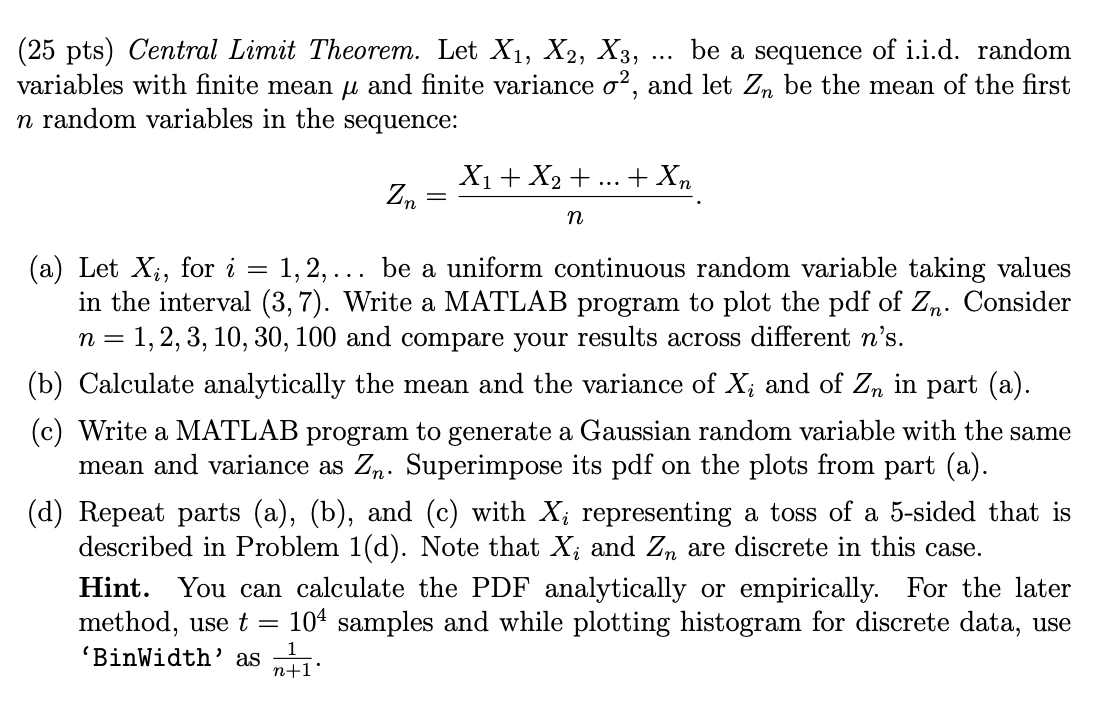
urgent solution for part c) and d) needed, thank you (25 pts) Central Limit Theorem. Let X1, X2, X3, be a sequence of i.i.d. random

urgent solution for part c) and d) needed, thank you

image text in transcribed

(25 pts) Central Limit Theorem. Let X1, X2, X3, be a sequence of i.i.d. random variables with finite mean u and finite variance o?, and let Zn be the mean of the first n random variables in the sequence: X1 + X2 + ... + Xn Zn n = (a) Let X, for i 1, 2, ... be a uniform continuous random variable taking values in the interval (3, 7). Write a MATLAB program to plot the pdf of Zn. Consider n=1, 2, 3, 10, 30, 100 and compare your results across different n's. (b) Calculate analytically the mean and the variance of X; and of Zn in part (a). (c) Write a MATLAB program to generate a Gaussian random variable with the same mean and variance as Zn. Superimpose its pdf on the plots from part (a). (d) Repeat parts (a), (b), and (c) with Xi representing a toss of a 5-sided that is described in Problem 1(d). Note that Xi and Zn are discrete in this case. Hint. You can calculate the PDF analytically or empirically. For the later method, use t = 104 samples and while plotting histogram for discrete data, use 'BinWidth' as n+1 (25 pts) Central Limit Theorem. Let X1, X2, X3, be a sequence of i.i.d. random variables with finite mean u and finite variance o?, and let Zn be the mean of the first n random variables in the sequence: X1 + X2 + ... + Xn Zn n = (a) Let X, for i 1, 2, ... be a uniform continuous random variable taking values in the interval (3, 7). Write a MATLAB program to plot the pdf of Zn. Consider n=1, 2, 3, 10, 30, 100 and compare your results across different n's. (b) Calculate analytically the mean and the variance of X; and of Zn in part (a). (c) Write a MATLAB program to generate a Gaussian random variable with the same mean and variance as Zn. Superimpose its pdf on the plots from part (a). (d) Repeat parts (a), (b), and (c) with Xi representing a toss of a 5-sided that is described in Problem 1(d). Note that Xi and Zn are discrete in this case. Hint. You can calculate the PDF analytically or empirically. For the later method, use t = 104 samples and while plotting histogram for discrete data, use 'BinWidth' as n+1

Step by Step Solution

There are 3 Steps involved in it

Step: 1

blur-text-image

Get Instant Access to Expert-Tailored Solutions

See step-by-step solutions with expert insights and AI powered tools for academic success

Step: 2

blur-text-image

Step: 3

blur-text-image

Ace Your Homework with AI

Get the answers you need in no time with our AI-driven, step-by-step assistance

Get Started

Recommended Textbook for

Learning MySQL Get A Handle On Your Data

Authors: Seyed M M Tahaghoghi

1st Edition

0596529465, 9780596529468

More Books

Students also viewed these Databases questions

Question

What is the difference between Needs and GAP Analyses?

Answered: 1 week ago

Question

What are ERP suites? Are HCMSs part of ERPs?

Answered: 1 week ago