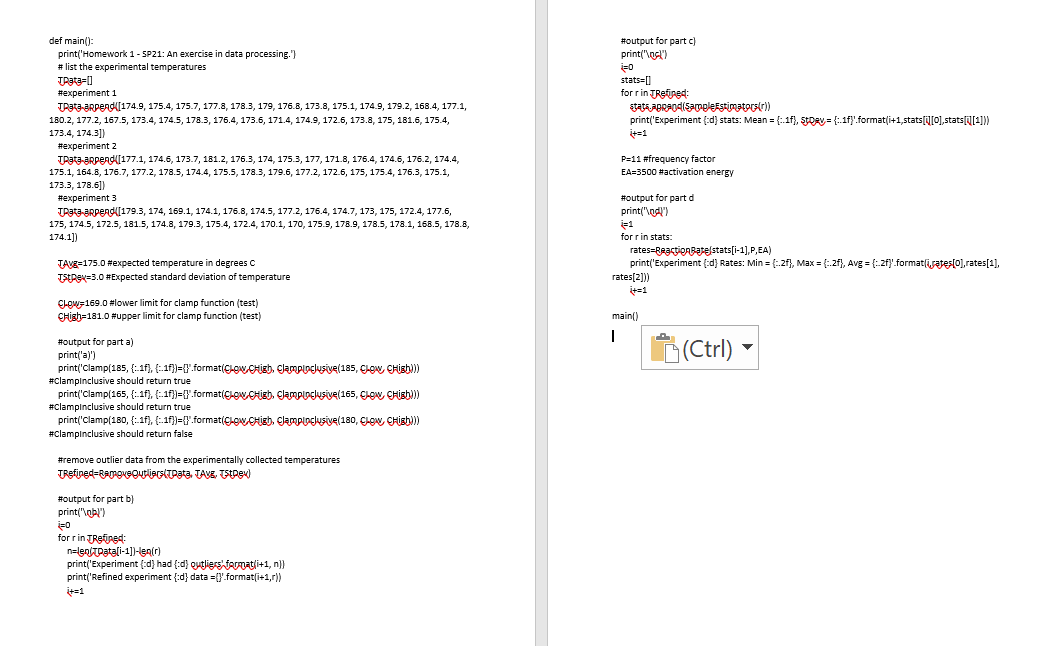
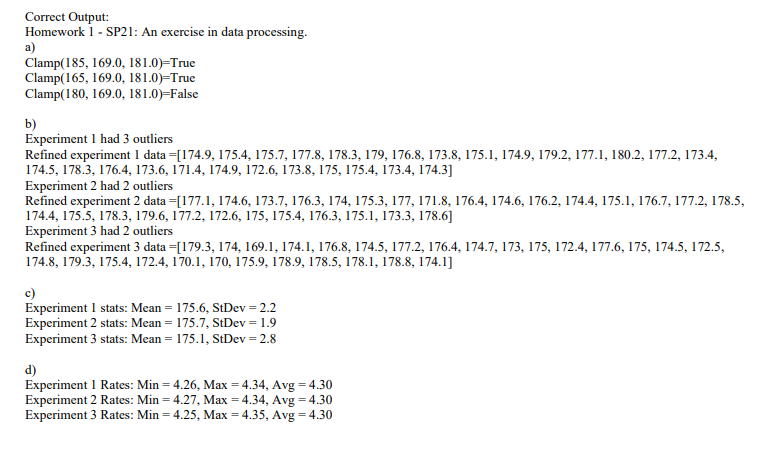
Question: Urgent: this is pyton programing due in 1hr. help please. The result will be math with the written language #output for partc) print( ) i=0
Urgent: this is pyton programing due in 1hr. help please. The result will be math with the written language


#output for partc) print(" ") i=0 stats=1 for r intretined: STATA ABRAH(SampleEstimators(r)) print('Experiment {:d} stats: Mean = {--1f}, Storv = {-1f'.format(i+1, stats[0][0],stats[0][1])) i=1 def main() print('Homework 1 - 5P21: An exercise in data processing.") # list the experimental temperatures Trata=0 #experiment 1 Trata-ERPEND([174.9, 175.4, 175.7, 177.8, 178.3, 179, 176.8, 173.8, 175.1, 174.9, 179.2, 168.4, 177.1, 180.2, 177.2, 167.5, 173.4, 174.5, 178.3, 176.4, 173.5, 171.4, 174.9, 172.5, 173.8, 175, 181.6, 175.4, 173.4, 174.311 #experiment 2 Trata-arpend([177.1, 174.6, 173.7, 181.2, 176.3, 174, 175.3, 177, 171.8, 176.4, 174.5, 176.2, 174.4, 175.1, 164.8, 176.7, 177.2, 178.5, 174.4, 175.5, 178.3, 179.6, 177.2, 172.5, 175, 175.4, 176.3, 175.1, 173.3, 178.6]] #experiments Trata-srpend([179.3, 174, 169.1, 174.1, 176.8, 174.5, 177.2, 176.4, 174.7, 173, 175, 172.4, 177.6, 175, 174.5, 172.5, 181.5, 174.8, 179.3, 175.4, 172.4, 170.1, 170, 175.9, 178.9, 178.5, 178.1, 168.5, 178.8, 174.1]) P=11 #frequency factor EA=3500 #activation energy #output for part d print("d") TAvg=175.0 #expected temperature in degrees C TSUPEx=3.0 #Expected standard deviation of temperature forrin stats: rates=Reaction Bate/stats[i-1],PEA) print('Experiment {:d} Rates: Min = {2.2f}, Max = {--2f}, Avg = {:.2f}.format(icates[o], rates[1], rates[21) Clow=169.0 #lower limit for clamp function (test) CHigh=181.0#upper limit for clamp function (test) main() I (Ctrl) #output for parta) print(a)') print('Clamp(185, {:-1f}, {-1f}=} .format(cow.High, Clamplaclusive(185, CLOW CHigh))) #Clampinclusive should return true print('Clamp(155, {:-1f}, {-1f})=1'.format(cow High, clamplaclusive(165, CLOW, CHigh))) #Clampinclusive should return true print('clamp(180, {:-1f}, {-1f})=1'.formaticow Figh, clamplaclusive(180, Low Chish))) #Clampinclusive should return false #remove outlier data from the experimentally collected temperatures Trefined=Remove outliersktPata, TAVE, TtDex) #output for part b) print(" ") =D for r in Trefined: n=len/tData[i-1])-lain) print('Experiment (:d} had {:d} outliers format(i+1, n}} print('Refined experiment{:d} data = {}format[i+1,r)) it=1 Correct Output: Homework 1 - SP21: An exercise in data processing. Clamp(185, 169.0, 181.0)=True Clamp(165, 169.0, 181.0)=True Clamp(180, 169.0, 181.0=False b) Experiment I had 3 outliers Refined experiment 1 data =[174.9, 175.4, 175.7, 177.8, 178.3, 179, 176.8, 173.8, 175.1, 174.9, 179.2, 177.1, 180.2, 177.2, 173.4, 174.5, 178.3, 176.4, 173.6, 171.4, 174.9, 172.6, 173.8, 175, 175.4, 173.4, 174.3] Experiment 2 had 2 outliers Refined experiment 2 data=[177.1, 174.6, 173.7, 176.3, 174, 175.3, 177, 171.8, 176.4, 174.6, 176.2, 174.4, 175.1, 176.7, 177.2, 178.5, 174.4, 175.5, 178.3, 179.6, 177.2, 172.6, 175, 175.4, 176.3, 175.1, 173.3, 178.6] Experiment 3 had 2 outliers Refined experiment 3 data=[179.3, 174, 169.1, 174.1, 176.8, 174.5, 177.2, 176.4, 174.7, 173, 175, 172.4, 177.6, 175, 174.5, 172.5, 174.8, 179.3, 175.4, 172.4, 170.1, 170, 175.9, 178.9, 178.5, 178.1, 178.8, 174.1] c) Experiment I stats: Mean = 175.6, StDev = 2.2 Experiment 2 stats: Mean = 175.7, StDev = 1.9 Experiment 3 stats: Mean = 175.1, StDev = 2.8 d) Experiment 1 Rates: Min = 4.26. Max = 4.34, Avg = 4.30 Experiment 2 Rates: Min = 4.27, Max = 4.34, Avg = 4.30 Experiment 3 Rates: Min = 4.25. Max = 4.35, Avg = 4.30 #output for partc) print(" ") i=0 stats=1 for r intretined: STATA ABRAH(SampleEstimators(r)) print('Experiment {:d} stats: Mean = {--1f}, Storv = {-1f'.format(i+1, stats[0][0],stats[0][1])) i=1 def main() print('Homework 1 - 5P21: An exercise in data processing.") # list the experimental temperatures Trata=0 #experiment 1 Trata-ERPEND([174.9, 175.4, 175.7, 177.8, 178.3, 179, 176.8, 173.8, 175.1, 174.9, 179.2, 168.4, 177.1, 180.2, 177.2, 167.5, 173.4, 174.5, 178.3, 176.4, 173.5, 171.4, 174.9, 172.5, 173.8, 175, 181.6, 175.4, 173.4, 174.311 #experiment 2 Trata-arpend([177.1, 174.6, 173.7, 181.2, 176.3, 174, 175.3, 177, 171.8, 176.4, 174.5, 176.2, 174.4, 175.1, 164.8, 176.7, 177.2, 178.5, 174.4, 175.5, 178.3, 179.6, 177.2, 172.5, 175, 175.4, 176.3, 175.1, 173.3, 178.6]] #experiments Trata-srpend([179.3, 174, 169.1, 174.1, 176.8, 174.5, 177.2, 176.4, 174.7, 173, 175, 172.4, 177.6, 175, 174.5, 172.5, 181.5, 174.8, 179.3, 175.4, 172.4, 170.1, 170, 175.9, 178.9, 178.5, 178.1, 168.5, 178.8, 174.1]) P=11 #frequency factor EA=3500 #activation energy #output for part d print("d") TAvg=175.0 #expected temperature in degrees C TSUPEx=3.0 #Expected standard deviation of temperature forrin stats: rates=Reaction Bate/stats[i-1],PEA) print('Experiment {:d} Rates: Min = {2.2f}, Max = {--2f}, Avg = {:.2f}.format(icates[o], rates[1], rates[21) Clow=169.0 #lower limit for clamp function (test) CHigh=181.0#upper limit for clamp function (test) main() I (Ctrl) #output for parta) print(a)') print('Clamp(185, {:-1f}, {-1f}=} .format(cow.High, Clamplaclusive(185, CLOW CHigh))) #Clampinclusive should return true print('Clamp(155, {:-1f}, {-1f})=1'.format(cow High, clamplaclusive(165, CLOW, CHigh))) #Clampinclusive should return true print('clamp(180, {:-1f}, {-1f})=1'.formaticow Figh, clamplaclusive(180, Low Chish))) #Clampinclusive should return false #remove outlier data from the experimentally collected temperatures Trefined=Remove outliersktPata, TAVE, TtDex) #output for part b) print(" ") =D for r in Trefined: n=len/tData[i-1])-lain) print('Experiment (:d} had {:d} outliers format(i+1, n}} print('Refined experiment{:d} data = {}format[i+1,r)) it=1 Correct Output: Homework 1 - SP21: An exercise in data processing. Clamp(185, 169.0, 181.0)=True Clamp(165, 169.0, 181.0)=True Clamp(180, 169.0, 181.0=False b) Experiment I had 3 outliers Refined experiment 1 data =[174.9, 175.4, 175.7, 177.8, 178.3, 179, 176.8, 173.8, 175.1, 174.9, 179.2, 177.1, 180.2, 177.2, 173.4, 174.5, 178.3, 176.4, 173.6, 171.4, 174.9, 172.6, 173.8, 175, 175.4, 173.4, 174.3] Experiment 2 had 2 outliers Refined experiment 2 data=[177.1, 174.6, 173.7, 176.3, 174, 175.3, 177, 171.8, 176.4, 174.6, 176.2, 174.4, 175.1, 176.7, 177.2, 178.5, 174.4, 175.5, 178.3, 179.6, 177.2, 172.6, 175, 175.4, 176.3, 175.1, 173.3, 178.6] Experiment 3 had 2 outliers Refined experiment 3 data=[179.3, 174, 169.1, 174.1, 176.8, 174.5, 177.2, 176.4, 174.7, 173, 175, 172.4, 177.6, 175, 174.5, 172.5, 174.8, 179.3, 175.4, 172.4, 170.1, 170, 175.9, 178.9, 178.5, 178.1, 178.8, 174.1] c) Experiment I stats: Mean = 175.6, StDev = 2.2 Experiment 2 stats: Mean = 175.7, StDev = 1.9 Experiment 3 stats: Mean = 175.1, StDev = 2.8 d) Experiment 1 Rates: Min = 4.26. Max = 4.34, Avg = 4.30 Experiment 2 Rates: Min = 4.27, Max = 4.34, Avg = 4.30 Experiment 3 Rates: Min = 4.25. Max = 4.35, Avg = 4.30
Step by Step Solution
There are 3 Steps involved in it

Get step-by-step solutions from verified subject matter experts


