Question
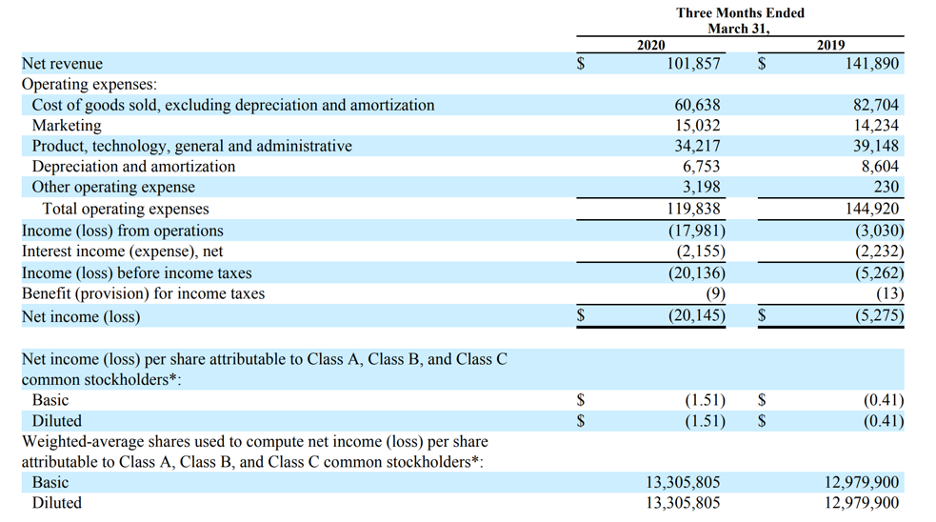
URGENT!! Using the Blue Apron financial statements 10QPreview the document, provide the following. Please show your work!!! Needs Calculation!!! Questions: 1) Revenue for the three
URGENT!!
Using the Blue Apron financial statements 10QPreview the document, provide the following.
Please show your work!!! Needs Calculation!!!


Questions:
1) Revenue for the three months ending March 31st, 2020 and 2019
2) Gross profit for the three months ending March 31st, 2020 and 2019
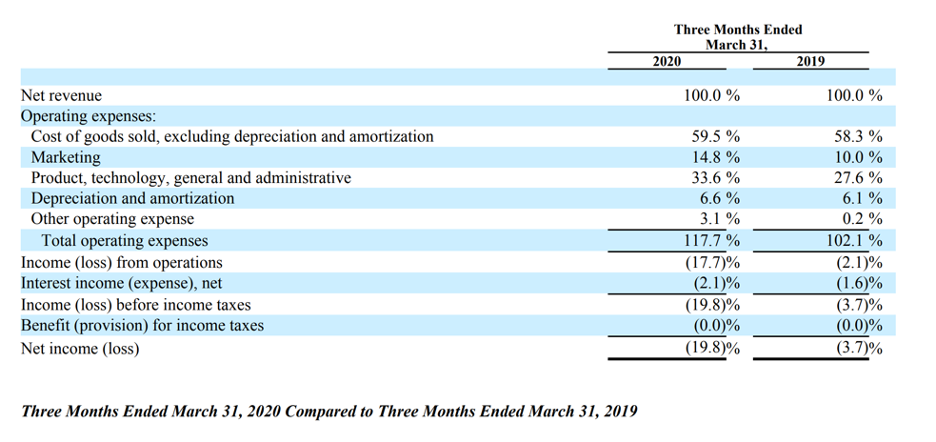
3) Cost of sales as a percentage of revenues for the three months ending March 31st, 2020 and 2019
4) Net income (loss) for the three months ending March 31st, 2020 and 2019
5) Net income as a % of revenue for the three months ending March 31st, 2020 and 2019
6) $ and % change from 2019 and 2020 for gross profit (% should be to the tenth e.g. 32.2%)
7) $ and % change from 2019 to 2020 for revenues
8) $ and % change from 2019 to 2020 for net income/loss
Please, needs calculation. If no calculation, no credit!!!!!
Thank you!
Three Months Ended March 31, 2020 101,857 $ 2019 141,890 $ Net revenue Operating expenses: Cost of goods sold, excluding depreciation and amortization Marketing Product, technology, general and administrative Depreciation and amortization Other operating expense Total operating expenses Income (loss) from operations Interest income (expense), net Income (loss) before income taxes Benefit (provision) for income taxes Net income (loss) 60,638 15,032 34,217 6,753 3,198 119,838 (17,981) (2,155) (20,136) (9) (20,145) 82,704 14,234 39,148 8,604 230 144,920 (3,030) (2,232) (5,262) (13) (5,275) $ $ $ Net income (loss) per share attributable to Class A, Class B, and Class C common stockholders*: Basic Diluted Weighted-average shares used to compute net income (loss) per share attributable to Class A, Class B, and Class C common stockholders*: Basic Diluted (1.51) (1.51) $ $ (0.41) (0.41) 13,305,805 13,305,805 12,979,900 12,979,900 Three Months Ended March 31, 2020 2019 100.0 % 100.0 % Net revenue Operating expenses: Cost of goods sold, excluding depreciation and amortization Marketing Product, technology, general and administrative Depreciation and amortization Other operating expense Total operating expenses Income (loss) from operations Interest income (expense), net Income (loss) before income taxes Benefit (provision) for income taxes Net income (loss) 59.5 % 14.8 % 33.6 % 6.6% 3.1 % 117.7 % (17.7)% (2.1)% (19.8% (0.0)% (19.8% 58.3 % 10.0 % 27.6 % 6.1 % 0.2 % 102.1 % (2.1)% (1.6% (3.7)% (0.0% (3.7)% Three Months Ended March 31, 2020 Compared to Three Months Ended March 31, 2019 Three Months Ended March 31, 2020 101,857 $ 2019 141,890 $ Net revenue Operating expenses: Cost of goods sold, excluding depreciation and amortization Marketing Product, technology, general and administrative Depreciation and amortization Other operating expense Total operating expenses Income (loss) from operations Interest income (expense), net Income (loss) before income taxes Benefit (provision) for income taxes Net income (loss) 60,638 15,032 34,217 6,753 3,198 119,838 (17,981) (2,155) (20,136) (9) (20,145) 82,704 14,234 39,148 8,604 230 144,920 (3,030) (2,232) (5,262) (13) (5,275) $ $ $ Net income (loss) per share attributable to Class A, Class B, and Class C common stockholders*: Basic Diluted Weighted-average shares used to compute net income (loss) per share attributable to Class A, Class B, and Class C common stockholders*: Basic Diluted (1.51) (1.51) $ $ (0.41) (0.41) 13,305,805 13,305,805 12,979,900 12,979,900 Three Months Ended March 31, 2020 2019 100.0 % 100.0 % Net revenue Operating expenses: Cost of goods sold, excluding depreciation and amortization Marketing Product, technology, general and administrative Depreciation and amortization Other operating expense Total operating expenses Income (loss) from operations Interest income (expense), net Income (loss) before income taxes Benefit (provision) for income taxes Net income (loss) 59.5 % 14.8 % 33.6 % 6.6% 3.1 % 117.7 % (17.7)% (2.1)% (19.8% (0.0)% (19.8% 58.3 % 10.0 % 27.6 % 6.1 % 0.2 % 102.1 % (2.1)% (1.6% (3.7)% (0.0% (3.7)% Three Months Ended March 31, 2020 Compared to Three Months Ended March 31, 2019Step by Step Solution
There are 3 Steps involved in it
Step: 1

Get Instant Access to Expert-Tailored Solutions
See step-by-step solutions with expert insights and AI powered tools for academic success
Step: 2

Step: 3

Ace Your Homework with AI
Get the answers you need in no time with our AI-driven, step-by-step assistance
Get Started


