

U.S. Civilian Labor Force (thousands) Year 2012 Year Labor Force Labor Force 2007 194,014 195,724 195,247...
Fantastic news! We've Found the answer you've been seeking!
Question:
Transcribed Image Text:
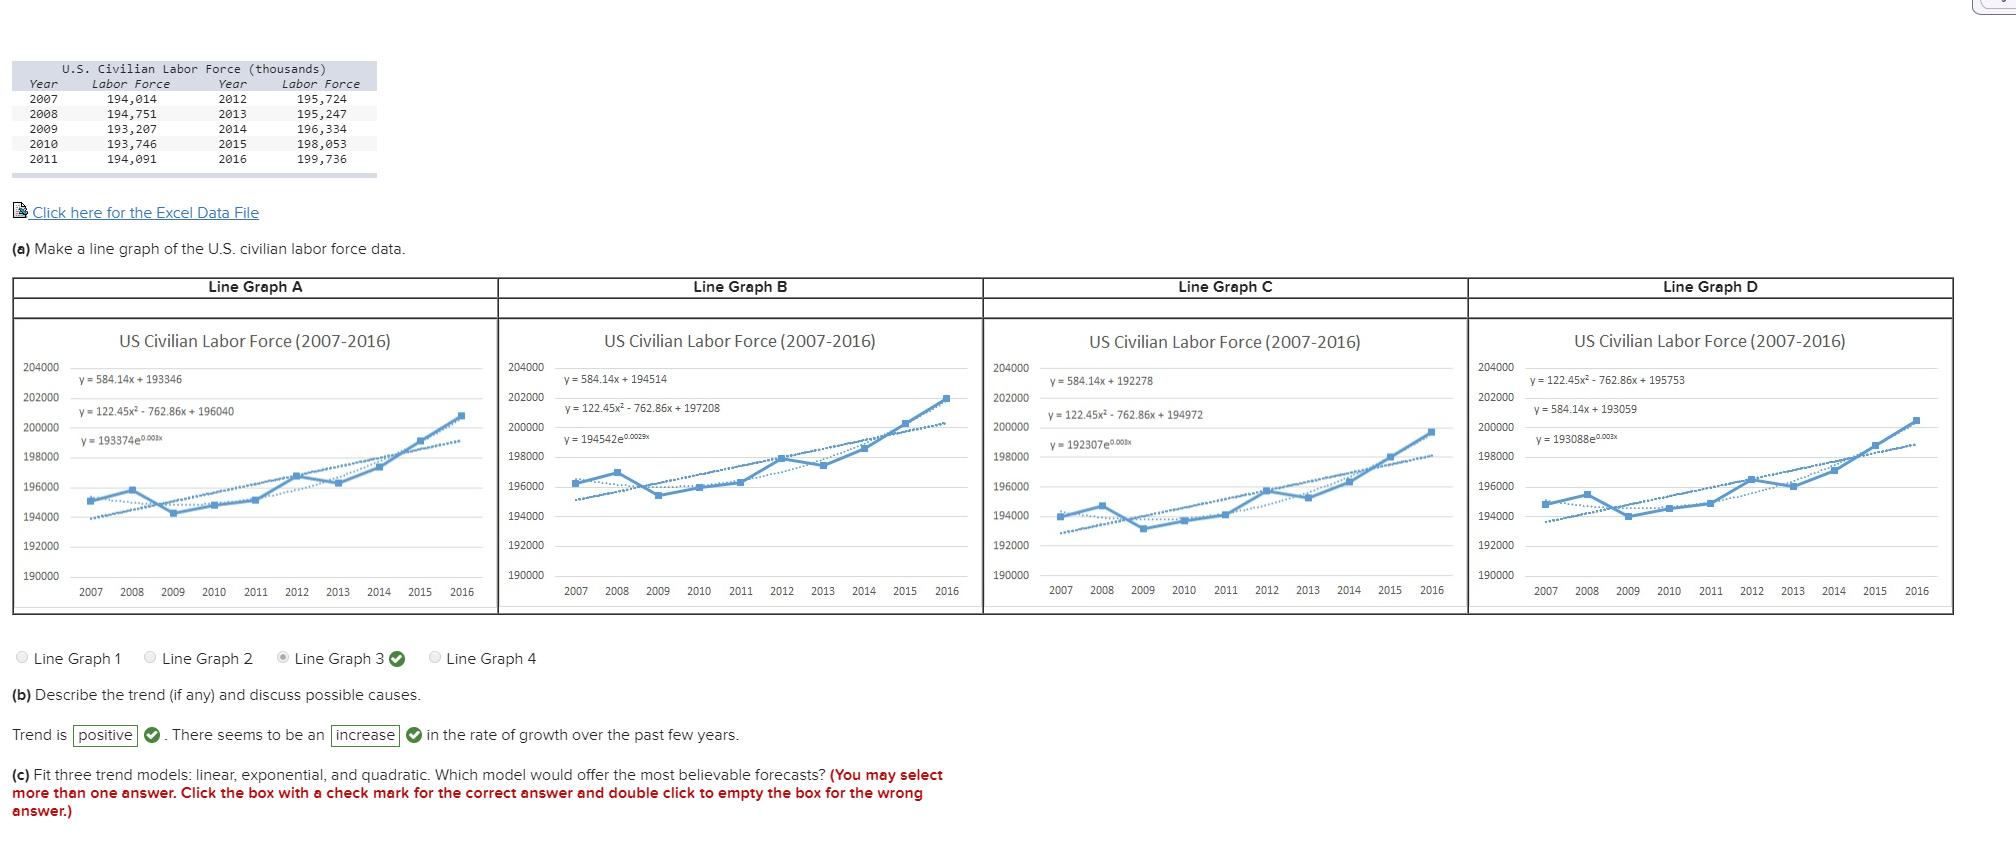
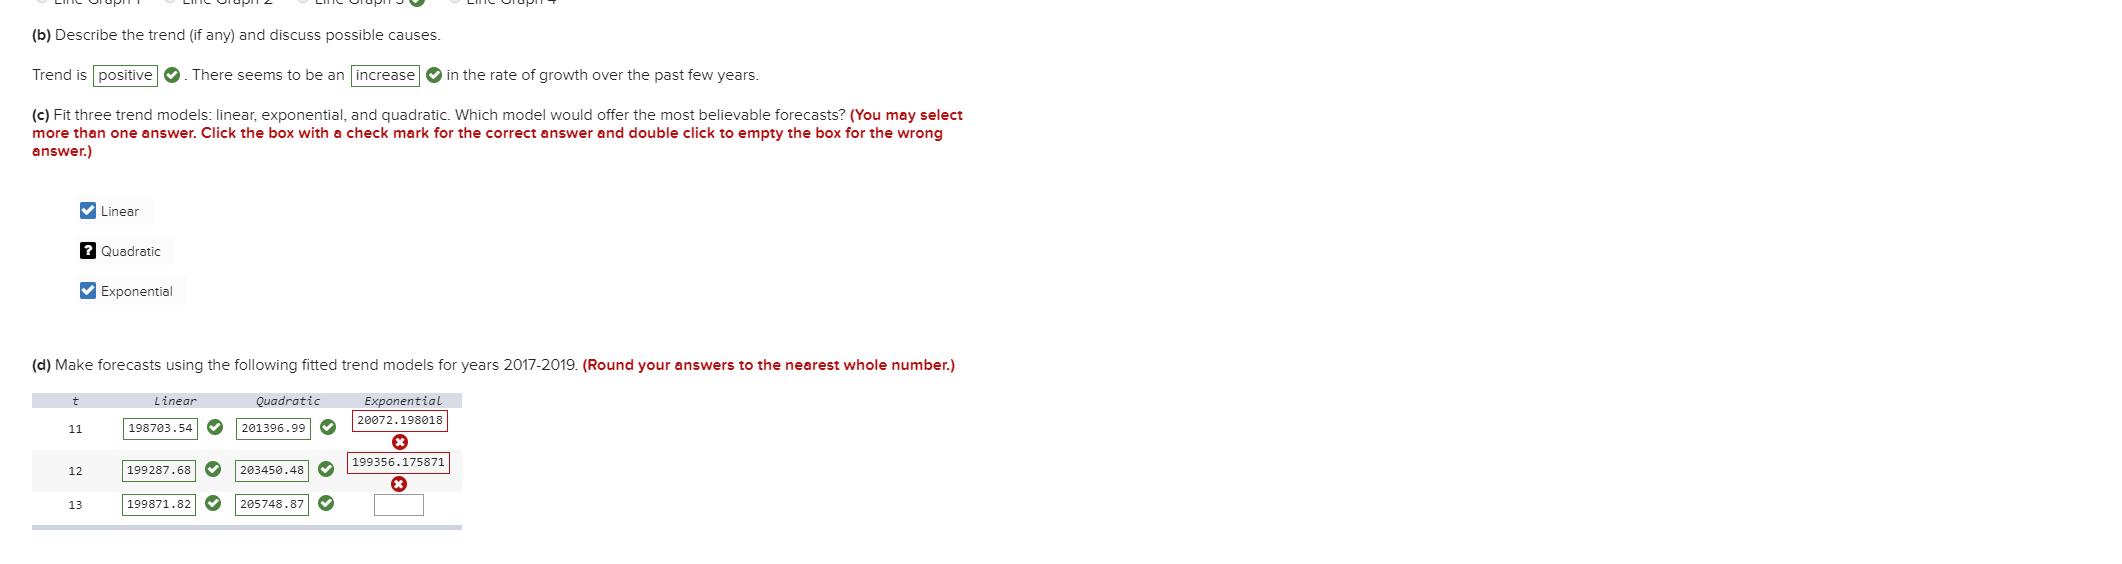
U.S. Civilian Labor Force (thousands) Year 2012 Year Labor Force Labor Force 2007 194,014 195,724 195,247 196,334 2008 194,751 2013 193, 207 193,746 194,091 2009 2014 2010 2015 198,053 199,736 2011 2016 E Click here for the Excel Data File (a) Make a line graph of the U.S. civilian labor force data. Line Graph A Line Graph B Line Graph C Line Graph D US Civilian Labor Force (2007-2016) US Civilian Labor Force (2007-2016) US Civilian Labor Force (2007-2016) US Civilian Labor Force (2007-2016) 204000 204000 204000 204000 y = 584.14x + 193346 y = 584.14x + 194514 y = 584.14x + 192278 y = 122.45x - 762.86x + 195753 202000 202000 202000 202000 y = 122.45x - 762.86x + 196040 y = 122.45x2 - 762.86x + 197208 y = 122.45x2 - 762.86x + 194972 y = 584.14x + 193059 200000 200000 200000 200000 y= 193374e0ax y= 194542e0002 y = 193088e0003. y= 192307e0N 198000 198000 198000 198000 196000 196000 196000 196000 194000 194000 194000 194000 192000 192000 192000 192000 190000 190000 190000 190000 2007 2008 2009 2010 2011 2012 2013 2014 2015 2016 2007 2008 2009 2010 2011 2012 2013 2014 2015 2016 2007 2008 2009 2010 2011 2012 2013 2014 2015 2016 2007 2008 2009 2010 2011 2012 2013 2014 2015 2016 O Line Graph 1 O Line Graph 2 O Line Graph 3 0 O Line Graph 4 (b) Describe the trend (if any) and discuss possible causes. Trend is positive O. There seems to be an increase O in the rate of growth over the past few years. (c) Fit three trend models: linear, exponential, and quadratic. Which model would offer the most believable forecasts? (You may select more than one answer. Click the box with a check mark for the correct answer and double click to empty the box for the wrong answer.) (b) Describe the trend (if any) and discuss possible causes. Trend is positive O. There seems to be an increase O in the rate of growth over the past few years. (c) Fit three trend models: linear, exponential, and quadratic. Which model would offer the most believable forecasts? (You may select more than one answer. Click the box with a check mark for the correct answer and double click to empty the box for the wrong answer.) V Linear ? Quadratic Exponential (d) Make forecasts using the following fitted trend models for years 2017-2019. (Round your answers to the nearest whole number.) Linear Quadratic Exponential 20072.198018 11 198703.54 O 201396.99 199356.175871 12 199287.68 |203450.48 13 199871.82 205748.87 U.S. Civilian Labor Force (thousands) Year 2012 Year Labor Force Labor Force 2007 194,014 195,724 195,247 196,334 2008 194,751 2013 193, 207 193,746 194,091 2009 2014 2010 2015 198,053 199,736 2011 2016 E Click here for the Excel Data File (a) Make a line graph of the U.S. civilian labor force data. Line Graph A Line Graph B Line Graph C Line Graph D US Civilian Labor Force (2007-2016) US Civilian Labor Force (2007-2016) US Civilian Labor Force (2007-2016) US Civilian Labor Force (2007-2016) 204000 204000 204000 204000 y = 584.14x + 193346 y = 584.14x + 194514 y = 584.14x + 192278 y = 122.45x - 762.86x + 195753 202000 202000 202000 202000 y = 122.45x - 762.86x + 196040 y = 122.45x2 - 762.86x + 197208 y = 122.45x2 - 762.86x + 194972 y = 584.14x + 193059 200000 200000 200000 200000 y= 193374e0ax y= 194542e0002 y = 193088e0003. y= 192307e0N 198000 198000 198000 198000 196000 196000 196000 196000 194000 194000 194000 194000 192000 192000 192000 192000 190000 190000 190000 190000 2007 2008 2009 2010 2011 2012 2013 2014 2015 2016 2007 2008 2009 2010 2011 2012 2013 2014 2015 2016 2007 2008 2009 2010 2011 2012 2013 2014 2015 2016 2007 2008 2009 2010 2011 2012 2013 2014 2015 2016 O Line Graph 1 O Line Graph 2 O Line Graph 3 0 O Line Graph 4 (b) Describe the trend (if any) and discuss possible causes. Trend is positive O. There seems to be an increase O in the rate of growth over the past few years. (c) Fit three trend models: linear, exponential, and quadratic. Which model would offer the most believable forecasts? (You may select more than one answer. Click the box with a check mark for the correct answer and double click to empty the box for the wrong answer.) (b) Describe the trend (if any) and discuss possible causes. Trend is positive O. There seems to be an increase O in the rate of growth over the past few years. (c) Fit three trend models: linear, exponential, and quadratic. Which model would offer the most believable forecasts? (You may select more than one answer. Click the box with a check mark for the correct answer and double click to empty the box for the wrong answer.) V Linear ? Quadratic Exponential (d) Make forecasts using the following fitted trend models for years 2017-2019. (Round your answers to the nearest whole number.) Linear Quadratic Exponential 20072.198018 11 198703.54 O 201396.99 199356.175871 12 199287.68 |203450.48 13 199871.82 205748.87
Expert Answer:

Related Book For 
The Essentials of Statistics A Tool for Social Research
ISBN: 978-1111829568
3rd edition
Authors: Joseph F. Healey
Posted Date:
Students also viewed these economics questions
-
(a) Make a line graph of the U.S. civilian labor force data. Line Graph 1 Line Graph 2 Line Graph 3 (b) Describe the trend (if any) and discuss possible causes. (c) Fit three trend models: linear,...
-
Use the Excel data file called Cars that you will find on Blackboard to complete this assignment Describe the distribution of each of the following variables in the file mpg engine year and cylinder...
-
Use the standard error to construct a prediction interval for Yusing an alpha of 5%. (Round your answer to 2 decimal places.) Prediction interval for Y: ;
-
?Claim: A of adults would erase all of their personalinformation online if they could. A software firm survey of 511randomly selected adults showed that 36 ?% of them would erase allof their pe...
-
Consider the following table showing one year's total sales (revenue) and profits for eight large retailers in the United States. a. Construct a scatterplot for the data. b. Briefly characterize the...
-
(a) Eliminate the parameter to find a Cartesian equation of the curve. (b) Sketch the curve and indicate with an arrow the direction in which the curve is traced as the parameter increases. y csc t,...
-
\(38 \times 6-4+5 \times 18 \div 10\) Perform the indicated calculation.
-
Parry Company has accounts receivable of $95,400 at March 31, 2012. An analysis of the accounts shows these amounts. Credit terms are 2/10, n/30. At March 31, 2012, there is a $2,100 credit balance...
-
Please choose a current public company look at their most recent form 10K. What does the company's auditors say about their control system? It's in the audit letter found near the end of the 10-...
-
1. If you were in Jimmies shoes, would you sell Greg an equity stake in Lees Ice Cream? Explain. If Jimmie does sell equity to Greg for $3,300, what percentage of the business should he offer? 2....
-
Monroe Company purchased 80% of Adams Company on January 1, 20X1.The purchase price paid was $600,000. On that day, the book value of Adams. was $500,000. Excess of cost over book value is due to...
-
The stock of Alpha Tool sells for $81.20 per share. Its current dividend rate, D 0 , is $3 per share. Analysts and investors expect Alpha to increase its dividends at a 20 percent rate for each of...
-
When a net force Fo is applied to an object with mass Mo, it experiences an acceleration of 300 cm/s. What will be the acceleration of an object with mass 2-Mo when a net force of Fo/2 is applied to...
-
On July 1, an American auto dealer enters into a contract to purchase 20 Mercedes sports cars with payment to be made in Euros on November 1.Each car will cost Euros 40,000.Dealer want to hedge the...
-
Given the following account balances after closing entries are posted, what is the total credit amount on the Post-Closing Trial balance (assume normal account balances)? Cash Accounts Receivable...
-
A stock's current dividend is 6 and the required rate of return on this stock is 12%. If the dividend growth rate is 9%, what should be the current stock price? *
-
I need the work shown to receive credit for the answers by tonight. Estimate: V = 0.15t * cos()) k 3 k 4 y_n+1 0.00749788 0.01499433 0.02074978 0.02248348 0.02997196 0.02299858 0.03746735 0.04491776...
-
How do network effects help Facebook fend off smaller social-networking rivals? Could an online retailer doing half as much business compete on an equal footing with Amazon in terms of costs? Explain.
-
At St. Algebra College, the sociology and psychology departments have been feuding for years about the respective quality of their programs. In an attempt to resolve the dispute, you have gathered...
-
As part of an evaluation of the efficiency of your local police force, you have gathered the following data on police response time to calls for assistance during two different years. (Response times...
-
In problem 3.8, you computed mean and median income for 13 Canadian provinces and territories in two separate years. Now compute the standard deviation and range for each year, and taking account of...
-
You are provided the following information about a company for two years (in millions): a. Days Sales in receivable index b. Gross margin index c. Sales growth index Any thoughts about this company?...
-
Go to the Association of Certified Fraud Examiners' website and find the 2004 Report to the Nation on Occupational Fraud and Abuse. a. How long does the average fraud scheme last? b. Applied to the...
-
Using the Internet or print media, find some examples of off-balance sheet ideas.

Study smarter with the SolutionInn App