Answered step by step
Verified Expert Solution
Link Copied!

Question

1 Approved Answer

US TREASURY YIELD CURVES 3.5 3 2.5 2 1.5 0.5 0 1 mo 3 mo 6 mo 1 yr 2 yr 3 yr 5 yr
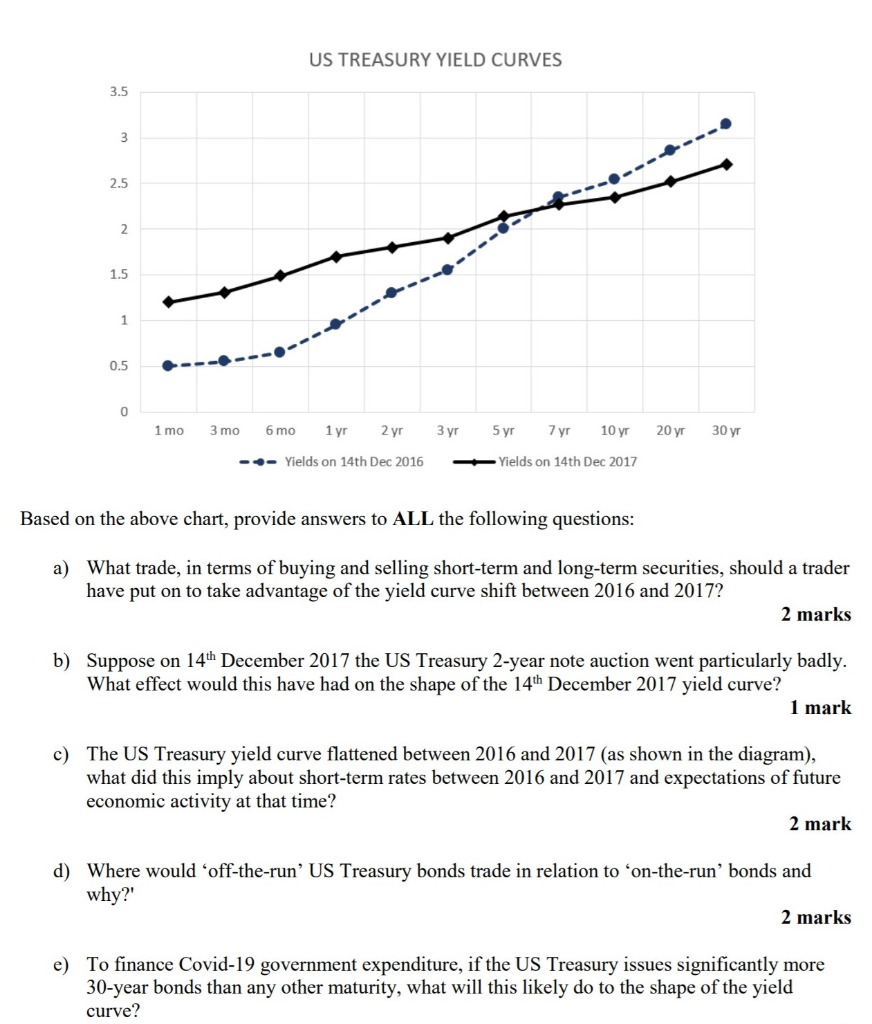
image text in transcribed

US TREASURY YIELD CURVES 3.5 3 2.5 2 1.5 0.5 0 1 mo 3 mo 6 mo 1 yr 2 yr 3 yr 5 yr 7 yr 10 yr 20 yr 30 yr --- Yields on 14th Dec 2016 Yields on 14th Dec 2017 Based on the above chart, provide answers to ALL the following questions: a) What trade, in terms of buying and selling short-term and long-term securities, should a trader have put on to take advantage of the yield curve shift between 2016 and 2017? 2 marks b) Suppose on 14th December 2017 the US Treasury 2-year note auction went particularly badly. What effect would this have had on the shape of the 14th December 2017 yield curve? 1 mark c) The US Treasury yield curve flattened between 2016 and 2017 (as shown in the diagram), what did this imply about short-term rates between 2016 and 2017 and expectations of future economic activity at that time? 2 mark d) Where would off-the-run' US Treasury bonds trade in relation to 'on-the-run' bonds and why?' 2 marks e) To finance Covid-19 government expenditure, if the US Treasury issues significantly more 30-year bonds than any other maturity, what will this likely do to the shape of the yield curve

Step by Step Solution

There are 3 Steps involved in it

Step: 1

blur-text-image

Get Instant Access to Expert-Tailored Solutions

See step-by-step solutions with expert insights and AI powered tools for academic success

Step: 2

blur-text-image_2

Step: 3

blur-text-image_3

Ace Your Homework with AI

Get the answers you need in no time with our AI-driven, step-by-step assistance

Get Started

Recommended Textbook for

The First Time Homebuyers Handbook

Authors: Dean Thompson

1st Edition

1658856112, 978-1658856119

More Books

Students also viewed these Finance questions