Answered step by step
Verified Expert Solution
Link Copied!

Question

1 Approved Answer

Use 12% return on the market Compute Target's required rate of return using the CAPM. Using the constant growth model (dividend growth model), calculate the
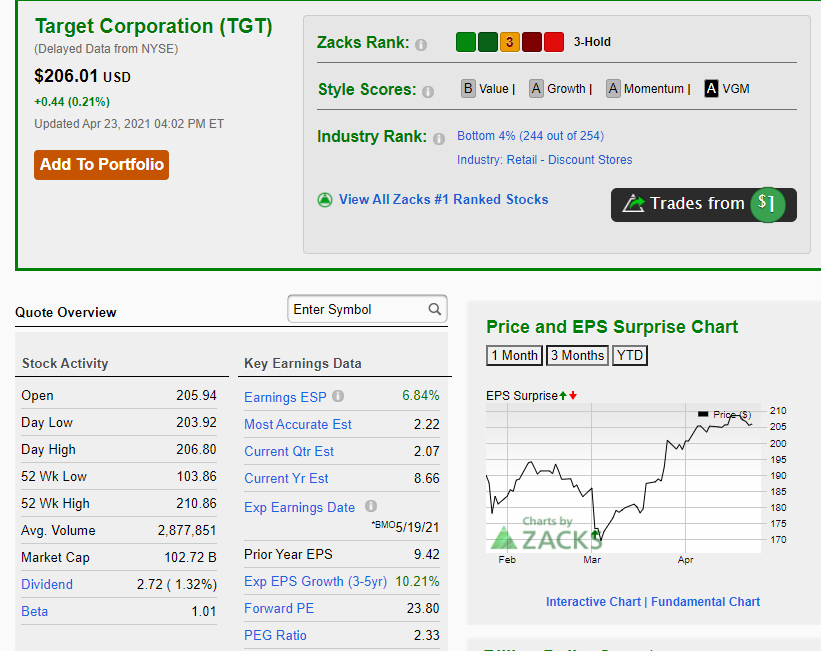
image text in transcribed

image text in transcribed

Use 12% return on the market

Compute Target's required rate of return using the CAPM. Using the constant growth model (dividend growth model), calculate the value of Targets stock.Is the stock overvalued or undervalued in the market? How can you tell?

Zacks Rank: 0 3-Hold Target Corporation (TGT) (Delayed Data from NYSE) $206.01 USD +0.44 (0.21%) Updated Apr 23, 2021 04:02 PM ET Style Scores: 0 B Value A Growth | A Momentum | A VGM Industry Rank: 0 Bottom 4% (244 out of 254) Industry: Retail - Discount Stores Add To Portfolio View All Zacks #1 Ranked Stocks Trades from $1 Quote Overview Enter Symbol a Price and EPS Surprise Chart 1 Month 3 Months YTD Stock Activity Key Earnings Data 205.94 6.84% EPS Surpriset 203.92 Prige 2 2.22 206.80 Earnings ESPO Most Accurate Est Current Qtr Est Current Yr Est Exp Earnings Date 2.07 103.86 Open Day Low Day High 52 Wk Low 52 Wk High Avg. Volume Market Cap Dividend 8.66 210 205 200 195 190 185 180 175 170 210.86 *SM05/19/21 Charts by ZACKS Feb Mar Apr 2,877,851 102.72 B 2.72 ( 1.32%) 1.01 Prior Year EPS 9.42 Exp EPS Growth (3-5yr) 10.21% Forward PE 23.80 PEG Ratio 2.33 Interactive Chart | Fundamental Chart Beta Zacks Rank: 0 3-Hold Target Corporation (TGT) (Delayed Data from NYSE) $206.01 USD +0.44 (0.21%) Updated Apr 23, 2021 04:02 PM ET Style Scores: 0 B Value A Growth | A Momentum | A VGM Industry Rank: 0 Bottom 4% (244 out of 254) Industry: Retail - Discount Stores Add To Portfolio View All Zacks #1 Ranked Stocks Trades from $1 Quote Overview Enter Symbol a Price and EPS Surprise Chart 1 Month 3 Months YTD Stock Activity Key Earnings Data 205.94 6.84% EPS Surpriset 203.92 Prige 2 2.22 206.80 Earnings ESPO Most Accurate Est Current Qtr Est Current Yr Est Exp Earnings Date 2.07 103.86 Open Day Low Day High 52 Wk Low 52 Wk High Avg. Volume Market Cap Dividend 8.66 210 205 200 195 190 185 180 175 170 210.86 *SM05/19/21 Charts by ZACKS Feb Mar Apr 2,877,851 102.72 B 2.72 ( 1.32%) 1.01 Prior Year EPS 9.42 Exp EPS Growth (3-5yr) 10.21% Forward PE 23.80 PEG Ratio 2.33 Interactive Chart | Fundamental Chart Beta

Step by Step Solution

There are 3 Steps involved in it

Step: 1

blur-text-image

Get Instant Access to Expert-Tailored Solutions

See step-by-step solutions with expert insights and AI powered tools for academic success

Step: 2

blur-text-image_2

Step: 3

blur-text-image_3

Ace Your Homework with AI

Get the answers you need in no time with our AI-driven, step-by-step assistance

Get Started

Recommended Textbook for

Seo Help 20 Steps To Get Your Website To Google S #1 Page

Authors: David Amerland

2nd Edition

1844819868, 978-1844819867

More Books

Students also viewed these Finance questions

Question

Explain four methods of delivery.

Answered: 1 week ago

Question

prelab: introducing measurements in the laboratory

Answered: 1 week ago