

Answered step by step
Verified Expert Solution
Question
1 Approved Answer
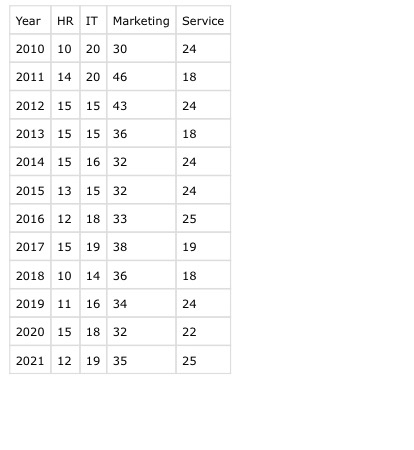
Use a bar chart to compare the head counts between the departments in 2 0 1 2 . Use a line chart to show the
Use a bar chart to compare the head counts between the departments in
Use a line chart to show the change of the head count of all the departments across the years.
Use a pie chart to show the distribution of the head counts in
Add title and labels or legends for your charts. Add inline comments before each task
Step by Step Solution
There are 3 Steps involved in it
Step: 1

Get Instant Access to Expert-Tailored Solutions
See step-by-step solutions with expert insights and AI powered tools for academic success
Step: 2

Step: 3
Ace Your Homework with AI
Get the answers you need in no time with our AI-driven, step-by-step assistance
Get Started
Database Security XI Status And Prospects
Authors: T.Y. Lin, Shelly Qian
1st Edition
0412820900, 978-0412820908