

Question
Use a graphical procedure and manual calculation to determine the optimal solution to the following linear program for decision-making purposes. Excel Linear Programing has been
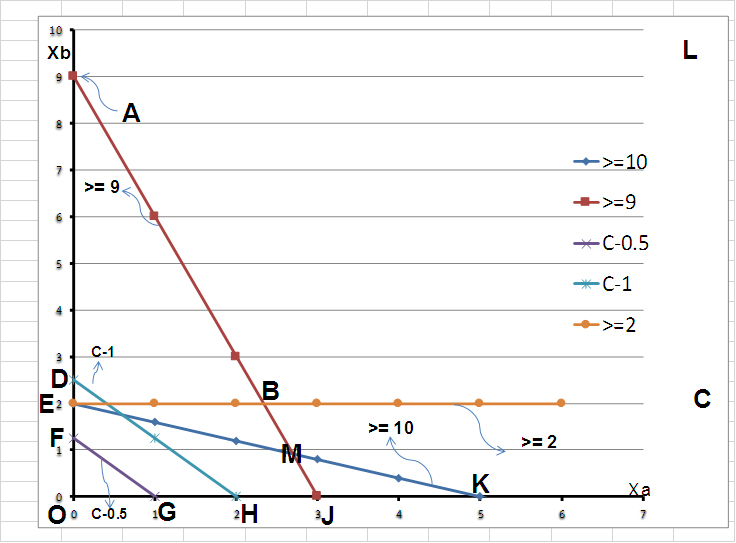
Use a graphical procedure and manual calculation to determine the optimal solution to the following linear program for decision-making purposes. Excel Linear Programing has been used to generate the following graph on the objective and constraints (please notice that you do not need to program in Excel, just use the outcomes given here to answer the questions):
Objective: Minimize cost CC= 0.5 Xa +0.4 Xb
Subject to:
2Xa + 5Xb >= 10
3Xa +Xb >=9
Xb >= 2
Where Xa and Xb are >= 0
Please notice Xa is taken on x-axis and Xb on y-axis
Instructions:
Note: Questions should be answered by looking at your objective and constraints and the provided Excel's graphical results (No Excel program needs to be developed):
- Identify the feasible region by the areas bounded with the letters. For example, you could identify your feasible solution region as: Area EBJ (just as an example).Hint, you need to test a point in each of the inequalities to determine the solution for each of them, and then decide what will be the final feasible solution region that matches all these inequalities.
- Show your optimum corner on the graph, as an example, point H, D, F, or whatever you think the correct optimum corner is. Calculate the coordinates (Xa and Xb) for this optimum point using the intersection of the 2 lines that optimum corner (mathematically and exact values, not just guessing from the graph).Hints, there are 2 trial cost lines plotted on the graph [C=1 and C=0.5] to show the direction of minimizing the cost within the feasible region.
- What is your minimized cost value for this model?
Step by Step Solution
There are 3 Steps involved in it
Step: 1

Get Instant Access to Expert-Tailored Solutions
See step-by-step solutions with expert insights and AI powered tools for academic success
Step: 2

Step: 3
Ace Your Homework with AI
Get the answers you need in no time with our AI-driven, step-by-step assistance
Get Started
Introduction to graph theory
Authors: Douglas B. West
2nd edition
131437372, 978-0131437371