

Answered step by step
Verified Expert Solution
Question
1 Approved Answer
Use an Arrhenius plot to determine the frequency factor for the reaction to two sig figs. (please answer part B, 3.5 is incorrect) The following
Use an Arrhenius plot to determine the frequency factor for the reaction to two sig figs. (please answer part B, 3.5 is incorrect) 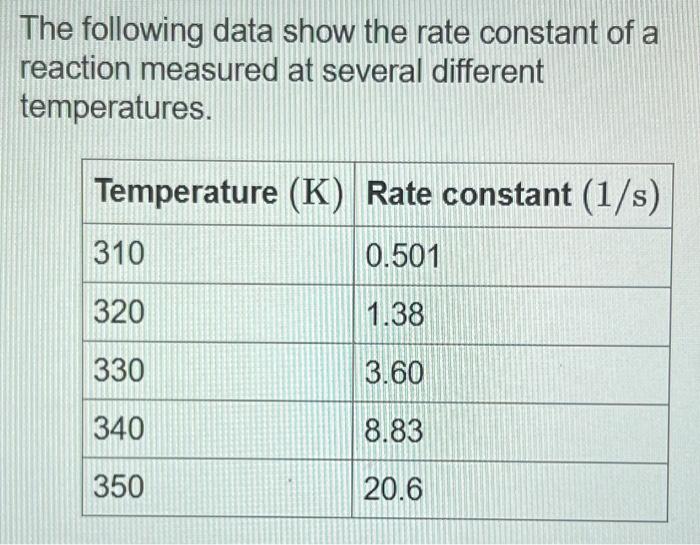
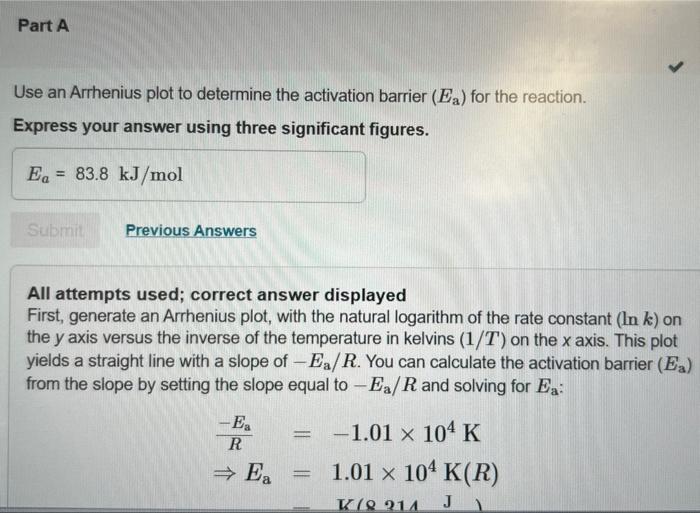
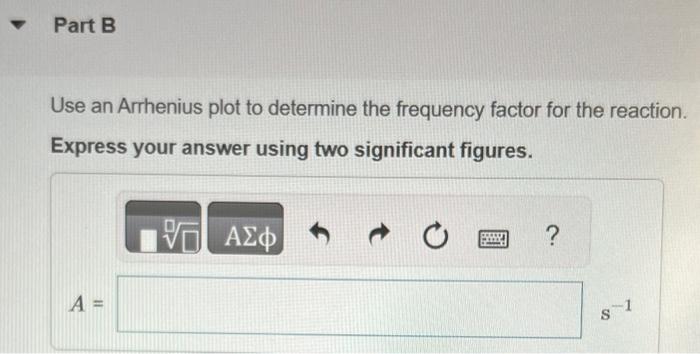
The following data show the rate constant of a reaction measured at several different temperatures. Use an Arrhenius plot to determine the activation barrier (Ea) for the reaction. Express your answer using three significant figures. All attempts used; correct answer displayed First, generate an Arrhenius plot, with the natural logarithm of the rate constant (lnk) on the y axis versus the inverse of the temperature in kelvins (1/T) on the x axis. This plot yields a straight line with a slope of Ea/R. You can calculate the activation barrier (Ea) from the slope by setting the slope equal to Ea/R and solving for Ea : REa=1.01104KEa=1.01104K(R) Use an Arrhenius plot to determine the frequency factor for the reaction. Express your answer using two significant figures Step by Step Solution
There are 3 Steps involved in it
Step: 1

Get Instant Access to Expert-Tailored Solutions
See step-by-step solutions with expert insights and AI powered tools for academic success
Step: 2

Step: 3
Ace Your Homework with AI
Get the answers you need in no time with our AI-driven, step-by-step assistance
Get Started
Organic Chemistry structure and function
Authors: K. Peter C. Vollhardt, Neil E. Schore
6th edition
142920494X, 978-1429204941