Question
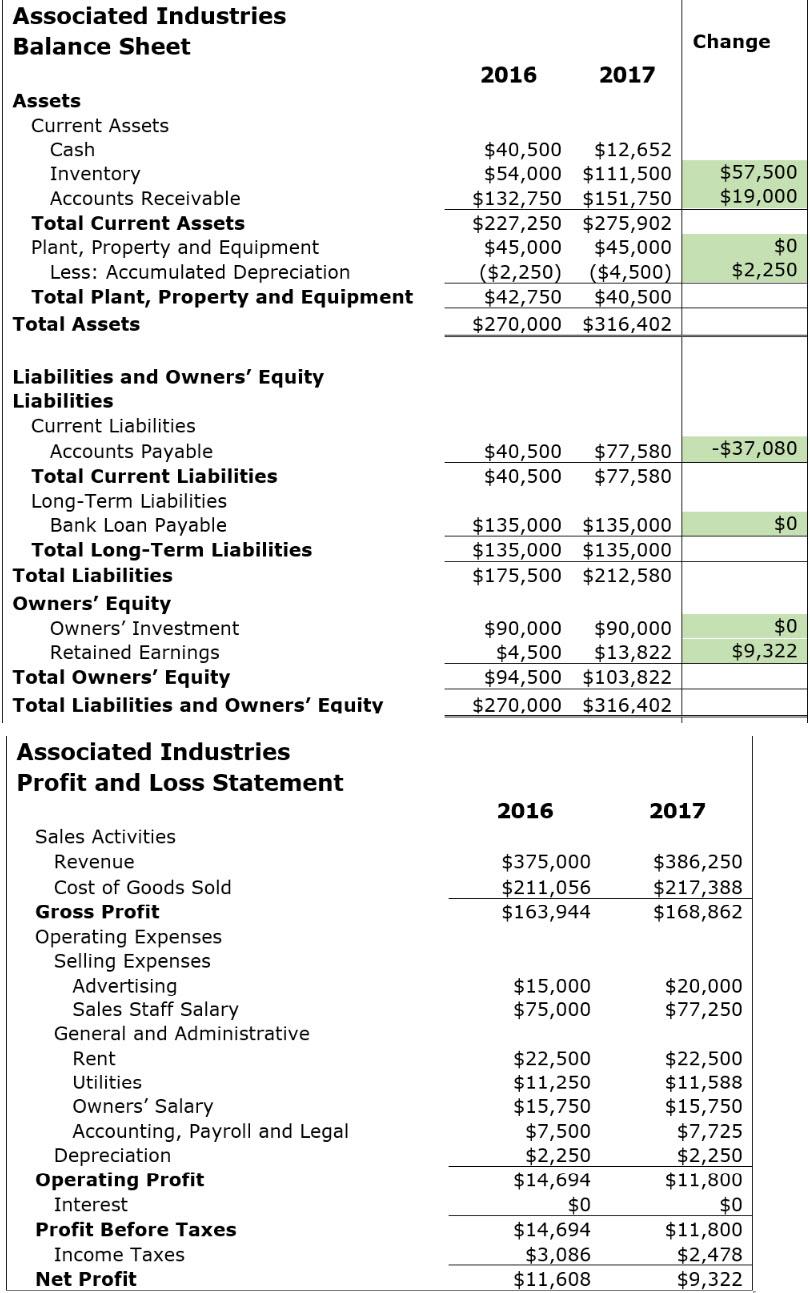
Use balance sheet and profit and loss statement to fill in the green blanks. Question: Now that we have determined there might be an operational
Use balance sheet and profit and loss statement to fill in the green blanks.

Question:
Now that we have determined there might be an operational issue, efficiency ratios should be used to further drill down into the data. Use the Associated Industries Balance sheet and Profit and Loss to calculate the efficiency ratios and working capital for 2016 and 2017. (Make sure to label all your answers appropriately.)
| Associated Industries |
|
| |
|
|
| 2016 | 2017 |
| Data |
|
|
|
| Inventory | $54,000 | $111,500 | |
| Accounts Receivable | $132,750 | $151,750 | |
| Accounts Payable | $40,500 | $77,580 | |
| Revenue |
| $375,000 | $386,250 |
| Cost of Goods Sold | $211,056 | $217,388 | |
| Current Assets |
| $227,250 | $275,902 |
| Current Liabilities |
| $40,500 | $77,580 |
| Total Assets |
| $270,000 | $316,402 |
| Revenue per Day |
|
|
|
| Cost of Goods Sold Per day |
|
|
|
|
Efficiency Ratios |
|
| |
| Days in Inventory |
|
| |
| Collection Period |
|
| |
| Payment Period |
|
| |
| Cash Conversion Cycle |
|
| |
| Inventory Turnover Ratio |
|
| |
| Asset Turnover Ratio |
|
| |
|
|
|
|
|
| Working Capital |
|
|
|
|
|
|
|
|
Step by Step Solution
There are 3 Steps involved in it
Step: 1

Get Instant Access to Expert-Tailored Solutions
See step-by-step solutions with expert insights and AI powered tools for academic success
Step: 2

Step: 3

Ace Your Homework with AI
Get the answers you need in no time with our AI-driven, step-by-step assistance
Get Started


