USe excel and show work


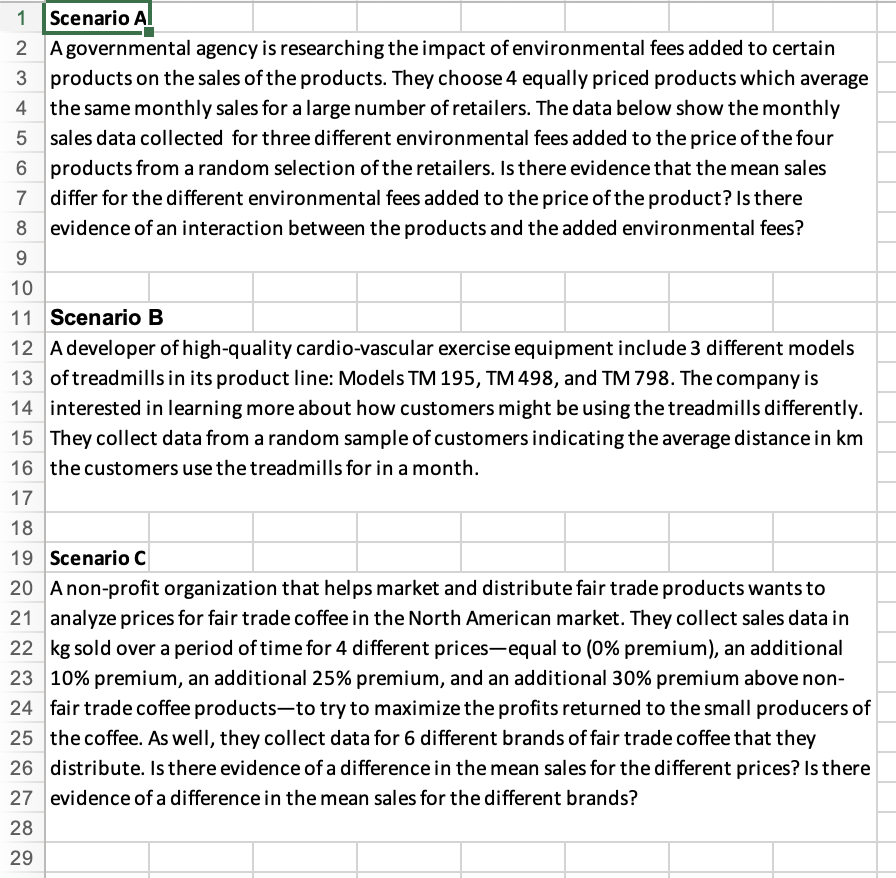
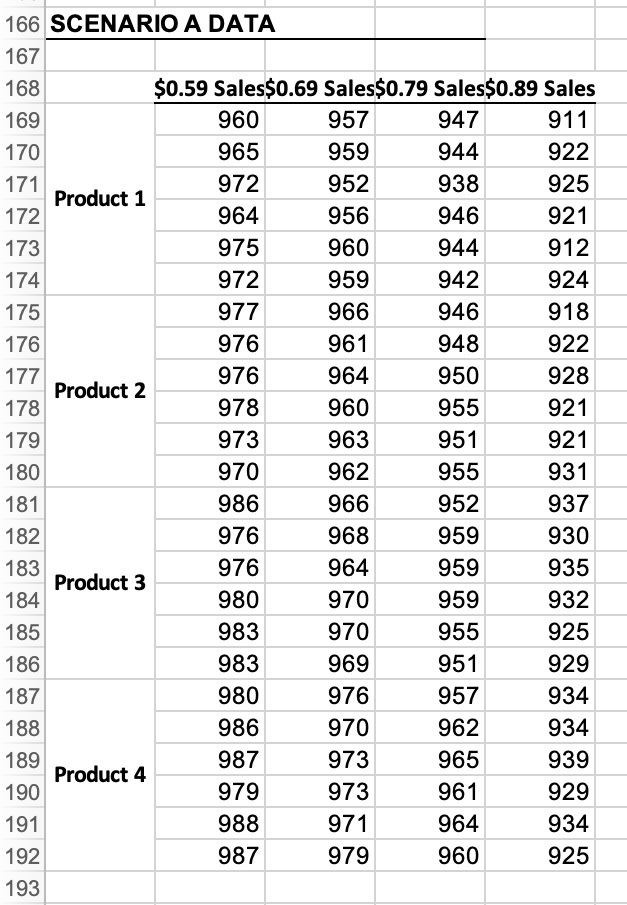
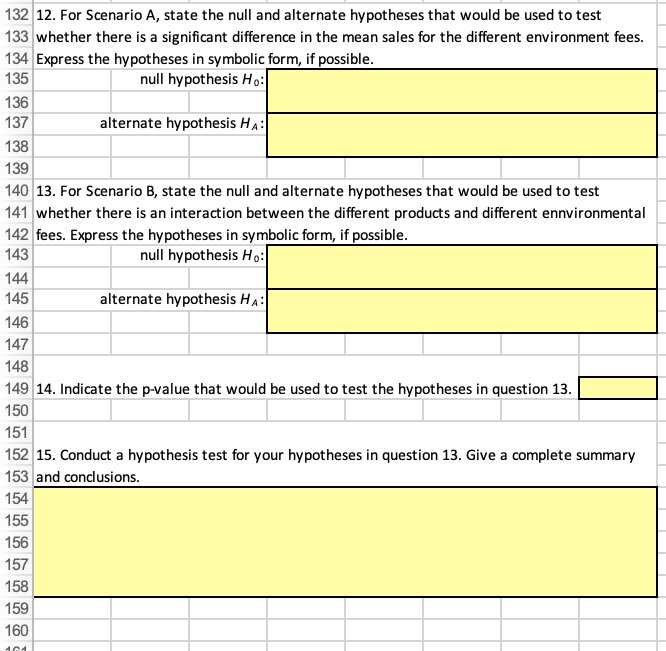
1 Scenario A! 2 Agovernmental agency is researching the impact of environmental fees added to certain 3 products on the sales of the products. They choose 4 equally priced products which average the same monthly sales for a large number of retailers. The data below show the monthly sales data collected for three different environmental fees added to the price of the four products from a random selection of the retailers. Is there evidence that the mean sales differ for the different environmental fees added to the price of the product? Is there evidence of an interaction between the products and the added environmental fees? 9 10 11 Scenario B 12 A developer of high-quality cardio-vascular exercise equipment include 3 different models 13 of treadmills in its product line: Models TM 195, TM 498, and TM 798. The company is 14 interested in learning more about how customers might be using the treadmills differently. 15 They collect data from a random sample of customers indicating the average distance in km 16 the customers use the treadmills for in a month. 17 18 19 Scenario C 20 Anon-profit organization that helps market and distribute fair trade products wants to 21 analyze prices for fair trade coffee in the North American market. They collect sales data in 22 kg sold over a period of time for 4 different prices-equal to (0% premium), an additional 23 10% premium, an additional 25% premium, and an additional 30% premium above non- 24 fair trade coffee products-to try to maximize the profits returned to the small producers of 25 the coffee. As well, they collect data for 6 different brands of fair trade coffee that they 26 distribute. Is there evidence of a difference in the mean sales for the different prices? Is there 27 evidence of a difference in the mean sales for the different brands? 28 29 172 166 SCENARIO A DATA 167 168 $0.59 Sales$0.69 Sales$0.79 Sales$0.89 Sales 169 960 957 947 911 170 965 959 944 922 171 972 952 938 925 Product 1 964 956 946 921 173 975 960 944 912 174 972 959 942 924 175 977 966 946 918 176 976 961 948 922 177 976 964 950 928 Product 2 178 978 960 955 921 179 973 963 951 921 180 970 962 955 931 181 986 966 952 937 182 976 968 959 930 183 976 964 959 935 Product 3 184 980 970 959 932 185 983 970 955 925 186 983 969 951 929 187 980 976 957 934 188 986 970 962 934 189 987 973 965 939 Product 4 190 979 973 961 929 191 988 971 964 934 192 987 979 960 925 193 SCENARIO B DATA Treadmill Models TM195 TM498 TM798 112 64 106 75 53 120 66 106 200 85 95 140 47 212 100 66 42 100 75 53 100 85 95 80 141 85 200 85 95 160 85 127 120 66 74 160 75 53 200 75 64 100 47 85 180 75 106 240 103 106 170 94 85 100 113 127 180 38 42 160 113 106 100 94 95 100 94 64 180 188 170 180 113 106 150 47 53 180 75 42 300 75 127 280 56 85 160 47 127 150 85 106 260 113 53 200 47 95 150 85 74 360 113 106 150 113 95 200 47 64 200 85 21 160 66 127 120 95 180 85 170 66 85 85 95 56 95 56 74 66 95 103 85 94 85 113 53 56 53 85 64 38 95 94 85 141 85 85 106 47 85 47 85 113 95 85 42 38 64 85 169 66 85 94 85 94 85 75 56 56 75 132 66 103 66 75 47 94 66 132 132 12. For Scenario A, state the null and alternate hypotheses that would be used to test 133 whether there is a significant difference in the mean sales for the different environment fees. 134 Express the hypotheses in symbolic form, if possible. 135 null hypothesis Ho: 136 137 alternate hypothesis HA: 138 139 140 13. For Scenario B, state the null and alternate hypotheses that would be used to test 141 whether there is an interaction between the different products and different ennvironmental 142 fees. Express the hypotheses in symbolic form, if possible. 143 null hypothesis Ho: 144 145 alternate hypothesis HA: 146 147 148 149 14. Indicate the p-value that would be used to test the hypotheses in question 13. 150 151 152 15. Conduct a hypothesis test for your hypotheses in question 13. Give a complete summary 153 and conclusions. 154 155 156 157 158 159 160 1 Scenario A! 2 Agovernmental agency is researching the impact of environmental fees added to certain 3 products on the sales of the products. They choose 4 equally priced products which average the same monthly sales for a large number of retailers. The data below show the monthly sales data collected for three different environmental fees added to the price of the four products from a random selection of the retailers. Is there evidence that the mean sales differ for the different environmental fees added to the price of the product? Is there evidence of an interaction between the products and the added environmental fees? 9 10 11 Scenario B 12 A developer of high-quality cardio-vascular exercise equipment include 3 different models 13 of treadmills in its product line: Models TM 195, TM 498, and TM 798. The company is 14 interested in learning more about how customers might be using the treadmills differently. 15 They collect data from a random sample of customers indicating the average distance in km 16 the customers use the treadmills for in a month. 17 18 19 Scenario C 20 Anon-profit organization that helps market and distribute fair trade products wants to 21 analyze prices for fair trade coffee in the North American market. They collect sales data in 22 kg sold over a period of time for 4 different prices-equal to (0% premium), an additional 23 10% premium, an additional 25% premium, and an additional 30% premium above non- 24 fair trade coffee products-to try to maximize the profits returned to the small producers of 25 the coffee. As well, they collect data for 6 different brands of fair trade coffee that they 26 distribute. Is there evidence of a difference in the mean sales for the different prices? Is there 27 evidence of a difference in the mean sales for the different brands? 28 29 172 166 SCENARIO A DATA 167 168 $0.59 Sales$0.69 Sales$0.79 Sales$0.89 Sales 169 960 957 947 911 170 965 959 944 922 171 972 952 938 925 Product 1 964 956 946 921 173 975 960 944 912 174 972 959 942 924 175 977 966 946 918 176 976 961 948 922 177 976 964 950 928 Product 2 178 978 960 955 921 179 973 963 951 921 180 970 962 955 931 181 986 966 952 937 182 976 968 959 930 183 976 964 959 935 Product 3 184 980 970 959 932 185 983 970 955 925 186 983 969 951 929 187 980 976 957 934 188 986 970 962 934 189 987 973 965 939 Product 4 190 979 973 961 929 191 988 971 964 934 192 987 979 960 925 193 SCENARIO B DATA Treadmill Models TM195 TM498 TM798 112 64 106 75 53 120 66 106 200 85 95 140 47 212 100 66 42 100 75 53 100 85 95 80 141 85 200 85 95 160 85 127 120 66 74 160 75 53 200 75 64 100 47 85 180 75 106 240 103 106 170 94 85 100 113 127 180 38 42 160 113 106 100 94 95 100 94 64 180 188 170 180 113 106 150 47 53 180 75 42 300 75 127 280 56 85 160 47 127 150 85 106 260 113 53 200 47 95 150 85 74 360 113 106 150 113 95 200 47 64 200 85 21 160 66 127 120 95 180 85 170 66 85 85 95 56 95 56 74 66 95 103 85 94 85 113 53 56 53 85 64 38 95 94 85 141 85 85 106 47 85 47 85 113 95 85 42 38 64 85 169 66 85 94 85 94 85 75 56 56 75 132 66 103 66 75 47 94 66 132 132 12. For Scenario A, state the null and alternate hypotheses that would be used to test 133 whether there is a significant difference in the mean sales for the different environment fees. 134 Express the hypotheses in symbolic form, if possible. 135 null hypothesis Ho: 136 137 alternate hypothesis HA: 138 139 140 13. For Scenario B, state the null and alternate hypotheses that would be used to test 141 whether there is an interaction between the different products and different ennvironmental 142 fees. Express the hypotheses in symbolic form, if possible. 143 null hypothesis Ho: 144 145 alternate hypothesis HA: 146 147 148 149 14. Indicate the p-value that would be used to test the hypotheses in question 13. 150 151 152 15. Conduct a hypothesis test for your hypotheses in question 13. Give a complete summary 153 and conclusions. 154 155 156 157 158 159 160


