

Question
Use Excel and the attached data set to run a regression and make any necessary additional calculations to fill in the blank spaces. Use a
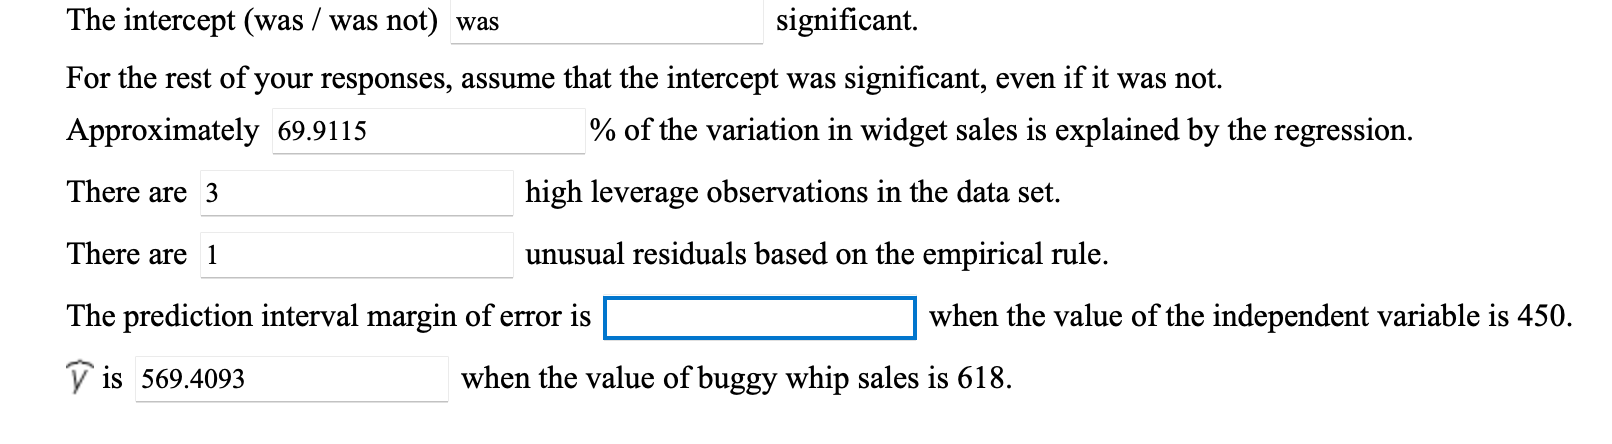
Use Excel and the attached data set to run a regression and make any necessary additional calculations to fill in the blank spaces. Use a 95% confidence level (.05 alpha) for all calculations requiring that information. Do not use any rounded values in any of your calculations. Round all your answers to 4 decimal places. Do not include any leading zeros in your responses for numbers that cannot be greater than 1. If the value is discrete, enter it as a whole number.
Step by Step Solution
There are 3 Steps involved in it
Step: 1

Get Instant Access to Expert-Tailored Solutions
See step-by-step solutions with expert insights and AI powered tools for academic success
Step: 2

Step: 3
Ace Your Homework with AI
Get the answers you need in no time with our AI-driven, step-by-step assistance
Get Started
Intermediate Algebra
Authors: Marvin L Bittinger
11th Edition
0321968395, 9780321968395