Answered step by step
Verified Expert Solution
Question
1 Approved Answer
USE EXCEL FOR THE CALCULATION USE EXCEL FOR THE CALCULATION The hydrocarbon emissions at idling speed in parts per million (ppm) for automobiles of 1980
USE EXCEL FOR THE CALCULATION

USE EXCEL FOR THE CALCULATION
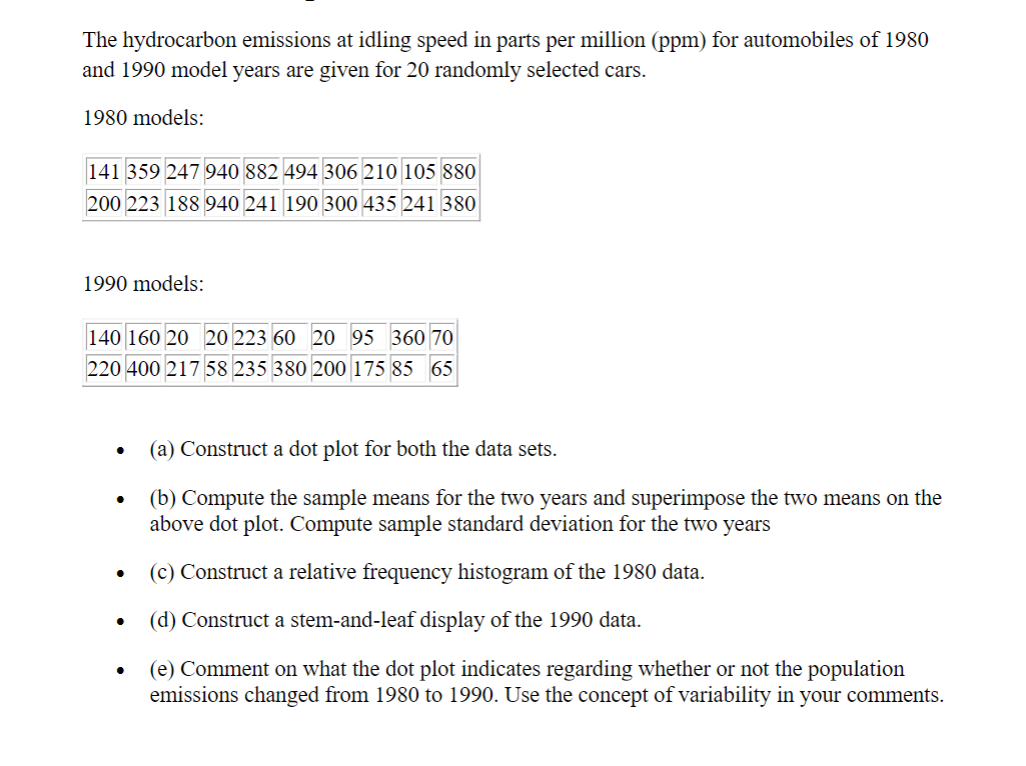
The hydrocarbon emissions at idling speed in parts per million (ppm) for automobiles of 1980 and 1990 model years are given for 20 randomly selected cars. 1980 models: 141 359 247 940 882 494 306 210 105 880 200 223 188 940 241 190 300 435 241 380 1990 models: 140 160 20 20 223 60 20 95 360 70 220 400 217 58 235 380 200 175 85 65 (a) Construct a dot plot for both the data sets. (b) Compute the sample means for the two years and superimpose the two means on the above dot plot. Compute sample standard deviation for the two years (c) Construct a relative frequency histogram of the 1980 data. (d) Construct a stem-and-leaf display of the 1990 data. (e) Comment on what the dot plot indicates regarding whether or not the population emissions changed from 1980 to 1990. Use the concept of variability in your commentsStep by Step Solution
There are 3 Steps involved in it
Step: 1

Get Instant Access to Expert-Tailored Solutions
See step-by-step solutions with expert insights and AI powered tools for academic success
Step: 2

Step: 3

Ace Your Homework with AI
Get the answers you need in no time with our AI-driven, step-by-step assistance
Get Started


