

Answered step by step
Verified Expert Solution
Question
1 Approved Answer
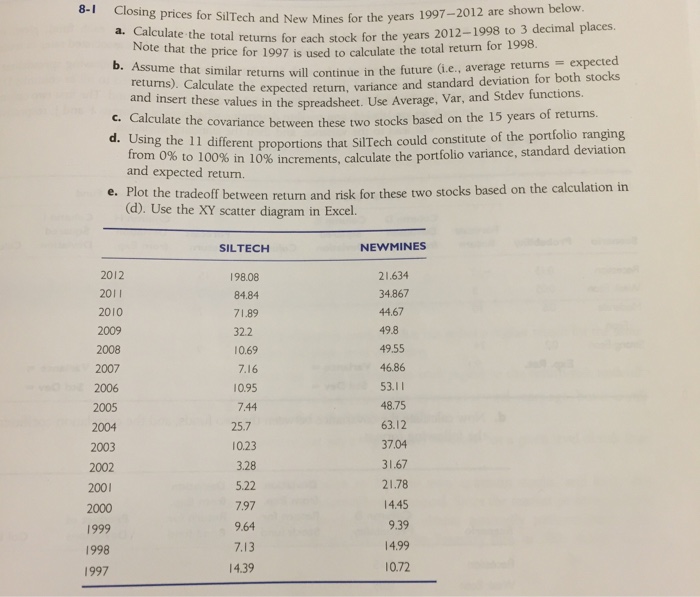
Use excel sheet Closing prices for SilTech and New Mines for the years 1997-2012 are shown below a. Calculate the total returns for each stock
 Use excel sheet
Step by Step Solution
There are 3 Steps involved in it
Step: 1

Get Instant Access to Expert-Tailored Solutions
See step-by-step solutions with expert insights and AI powered tools for academic success
Step: 2

Step: 3
Ace Your Homework with AI
Get the answers you need in no time with our AI-driven, step-by-step assistance
Get Started
Emotions In Finance Booms Busts And Uncertainty
Authors: Jocelyn Pixley
2nd Edition
1107633370, 978-1107633377