Use Exhibit B Table for information
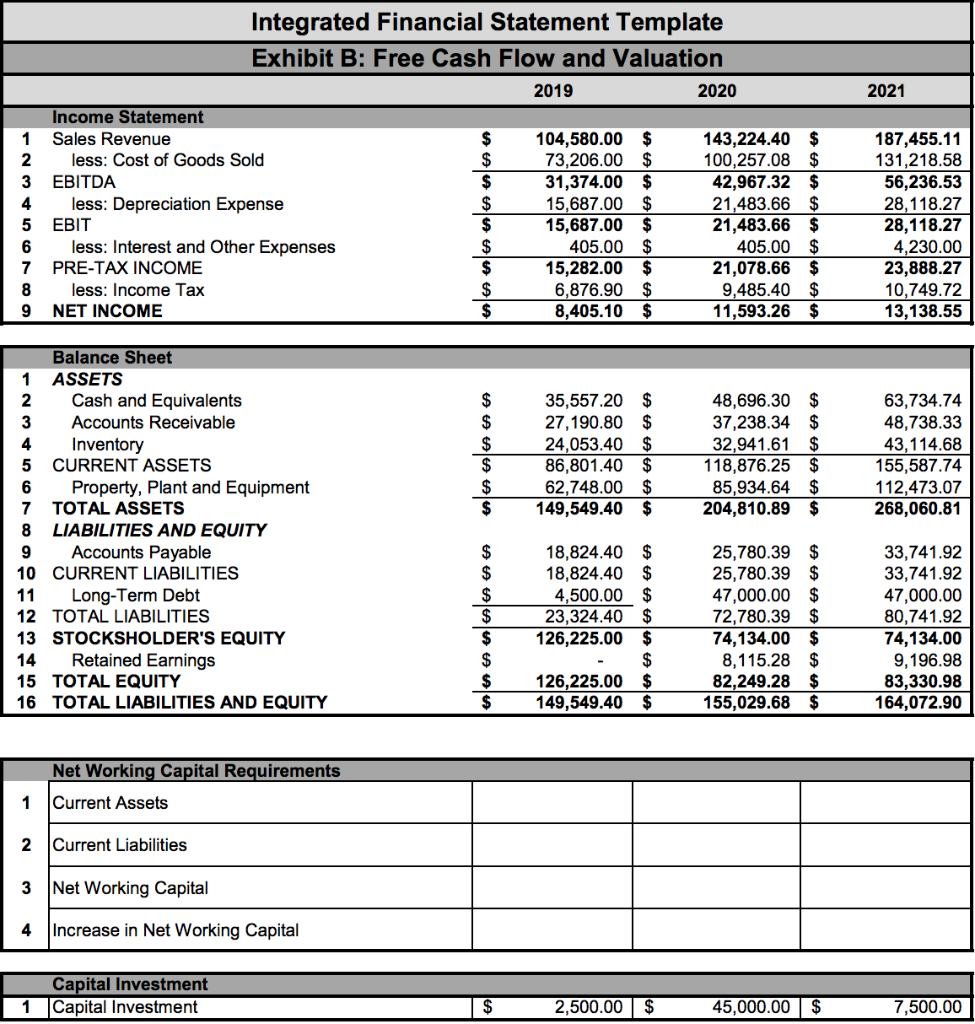
Exhibit B has the balance sheet and Income Statement projections for a specific company, Pepsi. The Pepsi company is evaluating if it is worth it to have the capital investment as showed in the Capital Investment Table. The EBITDA multiplier of similar companies 14.2. The debt used has a coupon of 10.5%. The WACC is 25%.
Place answers below
a. What is the increase in Net Working Capital for 2020? = 25,118.86
b. What is the increase in Net Working Capital for 2021? = 28749.96
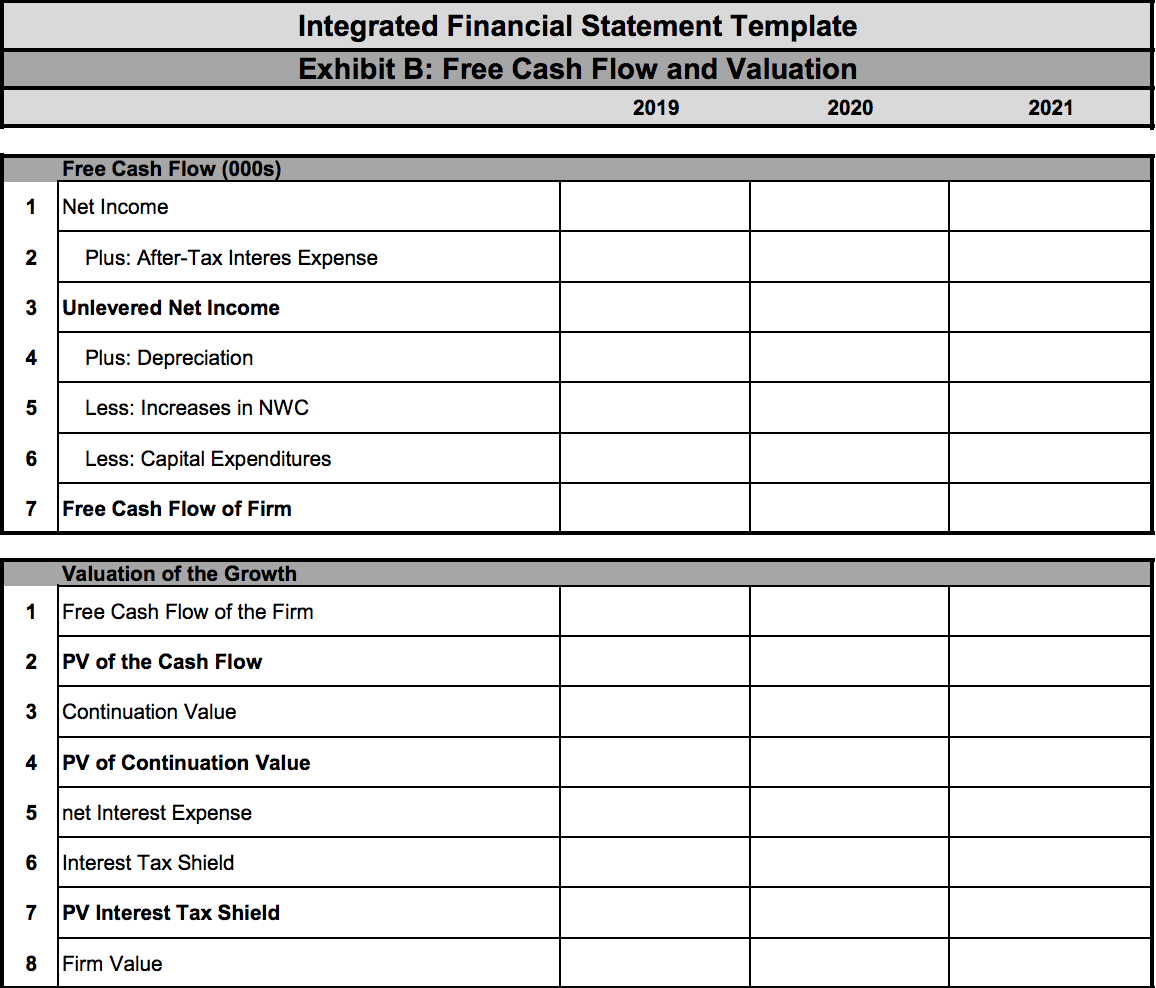
c. What would be the Free Cash Flow for 2020? = place answers here
d. What would be the Free Cash Flow for 2021?
e. What is the present value of the Free cash flows?
f. What is the present value of the continuation value for the firm?
g. What is the present value of the Interest Tax Shield?
h. What is the Firm Value with the expansion of the project?
Integrated Financial Statement Template Exhibit B: Free Cash Flow and Valuation 2019 2020 2021 $ $ $ 1 2 3 4 5 6 7 8 9 Income Statement Sales Revenue less: Cost of Goods Sold EBITDA less: Depreciation Expense EBIT less: Interest and Other Expenses PRE-TAX INCOME less: Income Tax NET INCOME $ A A A A 104,580.00 $ 73,206.00 $ 31,374.00 $ 15,687.00 $ 15,687.00 $ 405.00 $ 15,282.00 $ 6,876.90 $ 8,405.10 $ 143,224.40 $ 100,257.08 $ 42,967.32 $ 21,483.66 $ 21,483.66 $ 405.00 $ 21,078.66 $ 9,485.40 $ 11,593.26 $ 187,455.11 131,218.58 56,236.53 28,118.27 28,118.27 4,230.00 23,888.27 10,749.72 13,138.55 $ $ $ $ $ $ 35,557.20 $ 27,190.80 $ 24,053.40 $ 86,801.40 $ 62,748.00 $ 149,549.40 $ 48,696.30 $ 37,238.34 $ 32,941.61 $ 118,876.25 $ 85,934.64 $ 204,810.89 $ 63,734.74 48,738.33 43, 114.68 155,587.74 112,473.07 268,060.81 Balance Sheet 1 ASSETS 2 Cash and Equivalents 3 Accounts Receivable 4 Inventory 5 CURRENT ASSETS 6 Property, Plant and Equipment 7 TOTAL ASSETS 8 LIABILITIES AND EQUITY 9 Accounts Payable 10 CURRENT LIABILITIES 11 Long-Term Debt 12 TOTAL LIABILITIES 13 STOCKSHOLDER'S EQUITY 14 Retained Earnings 15 TOTAL EQUITY 16 TOTAL LIABILITIES AND EQUITY $ $ $ $ $ $ $ $ 18,824.40 $ 18,824.40 $ 4,500.00 $ 23,324.40 $ 126,225.00 $ $ 126,225.00 $ 149,549.40 $ 25,780.39 $ 25,780.39 $ 47,000.00 $ 72,780.39 $ 74,134.00 $ 8,115.28 $ 82,249.28 $ 155,029.68 $ 33,741.92 33,741.92 47,000.00 80,741.92 74,134.00 9,196.98 83,330.98 164,072.90 Net Working Capital Requirements 1 Current Assets 2 Current Liabilities 3 Net Working Capital 4 Increase in Net Working Capital Capital Investment Capital Investment 1 $ 2,500.00 $ 45,000.00 $ 7,500.00 Integrated Financial Statement Template Exhibit B: Free Cash Flow and Valuation 2019 2020 2021 $ $ $ 1 2 3 4 5 6 7 8 9 Income Statement Sales Revenue less: Cost of Goods Sold EBITDA less: Depreciation Expense EBIT less: Interest and Other Expenses PRE-TAX INCOME less: Income Tax NET INCOME $ A A A A 104,580.00 $ 73,206.00 $ 31,374.00 $ 15,687.00 $ 15,687.00 $ 405.00 $ 15,282.00 $ 6,876.90 $ 8,405.10 $ 143,224.40 $ 100,257.08 $ 42,967.32 $ 21,483.66 $ 21,483.66 $ 405.00 $ 21,078.66 $ 9,485.40 $ 11,593.26 $ 187,455.11 131,218.58 56,236.53 28,118.27 28,118.27 4,230.00 23,888.27 10,749.72 13,138.55 $ $ $ $ $ $ 35,557.20 $ 27,190.80 $ 24,053.40 $ 86,801.40 $ 62,748.00 $ 149,549.40 $ 48,696.30 $ 37,238.34 $ 32,941.61 $ 118,876.25 $ 85,934.64 $ 204,810.89 $ 63,734.74 48,738.33 43, 114.68 155,587.74 112,473.07 268,060.81 Balance Sheet 1 ASSETS 2 Cash and Equivalents 3 Accounts Receivable 4 Inventory 5 CURRENT ASSETS 6 Property, Plant and Equipment 7 TOTAL ASSETS 8 LIABILITIES AND EQUITY 9 Accounts Payable 10 CURRENT LIABILITIES 11 Long-Term Debt 12 TOTAL LIABILITIES 13 STOCKSHOLDER'S EQUITY 14 Retained Earnings 15 TOTAL EQUITY 16 TOTAL LIABILITIES AND EQUITY $ $ $ $ $ $ $ $ 18,824.40 $ 18,824.40 $ 4,500.00 $ 23,324.40 $ 126,225.00 $ $ 126,225.00 $ 149,549.40 $ 25,780.39 $ 25,780.39 $ 47,000.00 $ 72,780.39 $ 74,134.00 $ 8,115.28 $ 82,249.28 $ 155,029.68 $ 33,741.92 33,741.92 47,000.00 80,741.92 74,134.00 9,196.98 83,330.98 164,072.90 Net Working Capital Requirements 1 Current Assets 2 Current Liabilities 3 Net Working Capital 4 Increase in Net Working Capital Capital Investment Capital Investment 1 $ 2,500.00 $ 45,000.00 $ 7,500.00