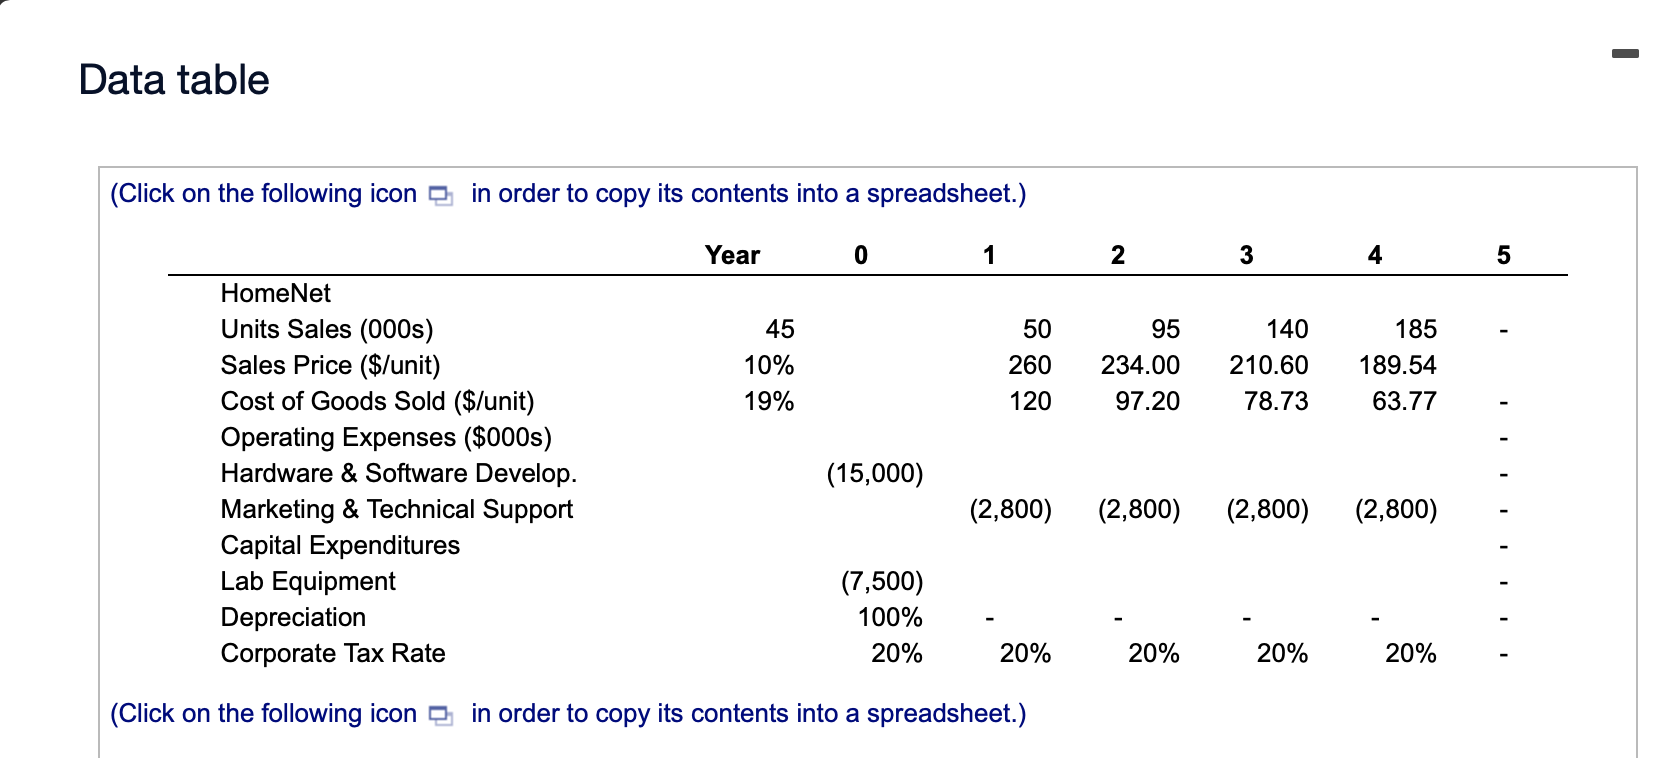
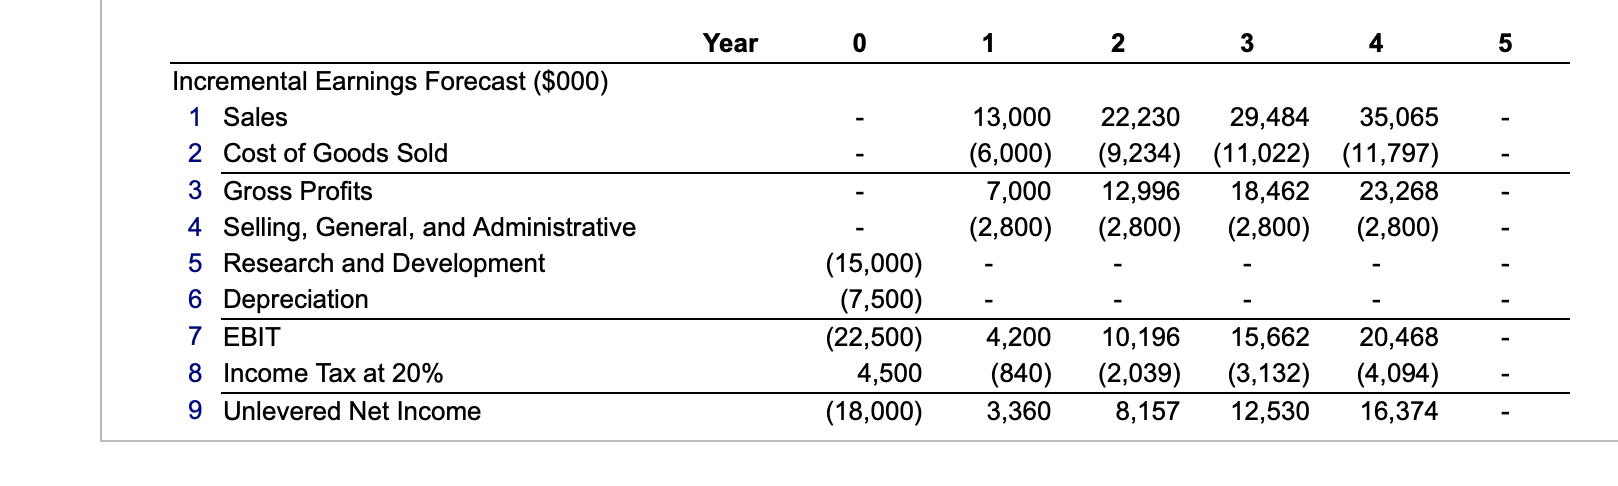
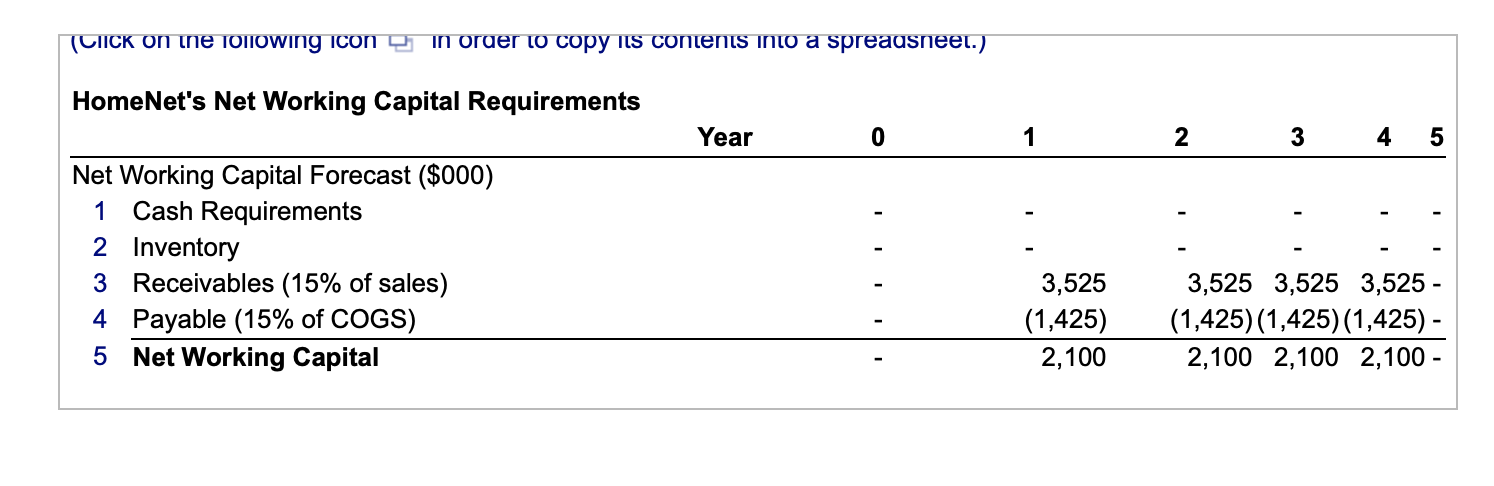
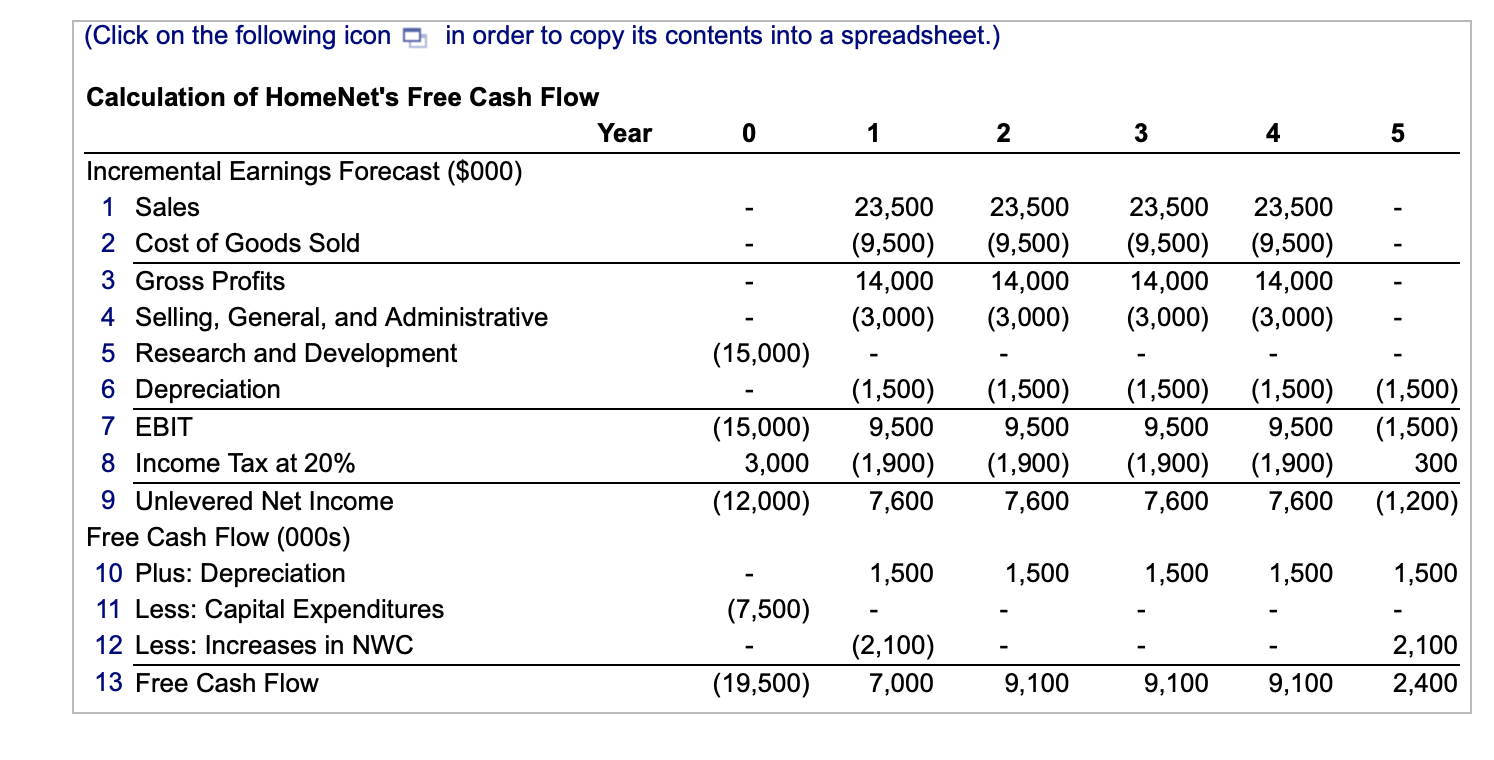
You are evaluating the HomeNet project under the following assumptions: Sales of 50,000 units in year 1 increasing by 45,000 units per year over the life of the project, a year 1 sales price of $260/unit, decreasing by 10% annually and a year 1 cost of $120/unit decreasing by 19% annually. In addition, new tax laws allow 100% bonus depreciation (all the depreciation expense occurs when the asset is put into use, in this case immediately). Research and development expenditures total $15 million in year 0 and selling, general, and administrative expenses are $2.8 million per year (assuming there is no cannibalization). Under these assumptions the unlevered net income is shown in the table: . Suppose that HomeNet will have no incremental cash or inventory requirements (products will be shipped directly from the contract manufacturer to customers). However, receivables related to HomeNet are expected to account for 15% of annual sales, and payables are expected to be 15% of the annual cost of goods sold. a. Calculate HomeNet's net working capital requirements (that is, reproduce Table 8.4 under the assumptions given). b. Calculate HomeNet's FCF (that is, reproduce Table 8.3 under the same assumptions). - Data table (Click on the following icon in order to copy its contents into a spreadsheet.) Year 0 1 2 3 4 5 01 50 45 10% 19% 260 120 95 234.00 97.20 140 210.60 78.73 185 189.54 63.77 HomeNet Units Sales (000s) Sales Price ($/unit) Cost of Goods Sold ($/unit) Operating Expenses ($000s) Hardware & Software Develop. Marketing & Technical Support Capital Expenditures Lab Equipment Depreciation Corporate Tax Rate (15,000) (2,800) (2,800) (2,800) (2,800) (7,500) 100% 20% 20% 20% 20% 20% (Click on the following icon in order to copy its contents into a spreadsheet.) Year 0 1 2 3 5 13,000 (6,000) 7,000 (2,800) 22,230 29,484 35,065 (9,234) (11,022) (11,797) 12,996 18,462 23,268 (2,800) (2,800) (2,800) Incremental Earnings Forecast ($000) 1 Sales 2 Cost of Goods Sold 3 Gross Profits 4 Selling, General, and Administrative 5 Research and Development 6 Depreciation 7 EBIT 8 Income Tax at 20% 9 Unlevered Net Income (15,000) (7,500) (22,500) 4,500 (18,000) 4,200 (840) 3,360 10,196 (2,039) 8,157 15,662 (3,132) 12,530 20,468 (4,094) 16,374 (CIICK on the following icon in order to copy its contents into a spreadsheet.) HomeNet's Net Working Capital Requirements Year 1 2 3 5 Net Working Capital Forecast ($000) 1 Cash Requirements 2 Inventory 3 Receivables (15% of sales) 4 Payable (15% of COGS) 5 Net Working Capital 3,525 (1,425) 2,100 3,525 3,525 3,525 - (1,425) (1,425) (1,425) - 2,100 2,100 2,100 - (Click on the following icon in order to copy its contents into a spreadsheet.) 0 1 2 3 4 5 23,500 (9,500) 14,000 (3,000) 23,500 (9,500) 14,000 (3,000) 23,500 (9,500) 14,000 (3,000) 23,500 (9,500) 14,000 (3,000) (15,000) Calculation of HomeNet's Free Cash Flow Year Incremental Earnings Forecast ($000) 1 Sales 2 Cost of Goods Sold 3 Gross Profits 4 Selling, General, and Administrative 5 Research and Development 6 Depreciation 7 EBIT Income Tax at 20% 9 Unlevered Net Income Free Cash Flow (000s) 10 Plus: Depreciation 11 Less: Capital Expenditures 12 Less: Increases in NWC 13 Free Cash Flow (15,000) 3,000 (12,000) (1,500) 9,500 (1,900) 7,600 (1,500) 9,500 (1,900) 7,600 (1,500) 9,500 (1,900) 7,600 (1,500) 9,500 (1,900) 7,600 (1,500) (1,500) 300 (1,200) 1,500 1,500 1,500 1,500 1,500 (7,500) (2,100) 7,000 2,100 2,400 (19,500) 9,100 9,100 9,100 You are evaluating the HomeNet project under the following assumptions: Sales of 50,000 units in year 1 increasing by 45,000 units per year over the life of the project, a year 1 sales price of $260/unit, decreasing by 10% annually and a year 1 cost of $120/unit decreasing by 19% annually. In addition, new tax laws allow 100% bonus depreciation (all the depreciation expense occurs when the asset is put into use, in this case immediately). Research and development expenditures total $15 million in year 0 and selling, general, and administrative expenses are $2.8 million per year (assuming there is no cannibalization). Under these assumptions the unlevered net income is shown in the table: . Suppose that HomeNet will have no incremental cash or inventory requirements (products will be shipped directly from the contract manufacturer to customers). However, receivables related to HomeNet are expected to account for 15% of annual sales, and payables are expected to be 15% of the annual cost of goods sold. a. Calculate HomeNet's net working capital requirements (that is, reproduce Table 8.4 under the assumptions given). b. Calculate HomeNet's FCF (that is, reproduce Table 8.3 under the same assumptions). - Data table (Click on the following icon in order to copy its contents into a spreadsheet.) Year 0 1 2 3 4 5 01 50 45 10% 19% 260 120 95 234.00 97.20 140 210.60 78.73 185 189.54 63.77 HomeNet Units Sales (000s) Sales Price ($/unit) Cost of Goods Sold ($/unit) Operating Expenses ($000s) Hardware & Software Develop. Marketing & Technical Support Capital Expenditures Lab Equipment Depreciation Corporate Tax Rate (15,000) (2,800) (2,800) (2,800) (2,800) (7,500) 100% 20% 20% 20% 20% 20% (Click on the following icon in order to copy its contents into a spreadsheet.) Year 0 1 2 3 5 13,000 (6,000) 7,000 (2,800) 22,230 29,484 35,065 (9,234) (11,022) (11,797) 12,996 18,462 23,268 (2,800) (2,800) (2,800) Incremental Earnings Forecast ($000) 1 Sales 2 Cost of Goods Sold 3 Gross Profits 4 Selling, General, and Administrative 5 Research and Development 6 Depreciation 7 EBIT 8 Income Tax at 20% 9 Unlevered Net Income (15,000) (7,500) (22,500) 4,500 (18,000) 4,200 (840) 3,360 10,196 (2,039) 8,157 15,662 (3,132) 12,530 20,468 (4,094) 16,374 (CIICK on the following icon in order to copy its contents into a spreadsheet.) HomeNet's Net Working Capital Requirements Year 1 2 3 5 Net Working Capital Forecast ($000) 1 Cash Requirements 2 Inventory 3 Receivables (15% of sales) 4 Payable (15% of COGS) 5 Net Working Capital 3,525 (1,425) 2,100 3,525 3,525 3,525 - (1,425) (1,425) (1,425) - 2,100 2,100 2,100 - (Click on the following icon in order to copy its contents into a spreadsheet.) 0 1 2 3 4 5 23,500 (9,500) 14,000 (3,000) 23,500 (9,500) 14,000 (3,000) 23,500 (9,500) 14,000 (3,000) 23,500 (9,500) 14,000 (3,000) (15,000) Calculation of HomeNet's Free Cash Flow Year Incremental Earnings Forecast ($000) 1 Sales 2 Cost of Goods Sold 3 Gross Profits 4 Selling, General, and Administrative 5 Research and Development 6 Depreciation 7 EBIT Income Tax at 20% 9 Unlevered Net Income Free Cash Flow (000s) 10 Plus: Depreciation 11 Less: Capital Expenditures 12 Less: Increases in NWC 13 Free Cash Flow (15,000) 3,000 (12,000) (1,500) 9,500 (1,900) 7,600 (1,500) 9,500 (1,900) 7,600 (1,500) 9,500 (1,900) 7,600 (1,500) 9,500 (1,900) 7,600 (1,500) (1,500) 300 (1,200) 1,500 1,500 1,500 1,500 1,500 (7,500) (2,100) 7,000 2,100 2,400 (19,500) 9,100 9,100 9,100