Answered step by step
Verified Expert Solution
Question
1 Approved Answer
Use formulas to calculate the following financial indicators for each year of data (as shown below) for the company Apple: o Current ratio o Debt/equity
Use formulas to calculate the following financial indicators for each year of data (as shown below) for the company Apple:
o Current ratio
o Debt/equity ratio
o Free cash flow
o Earnings per share
o Price/earnings ratio
o Return on equity
o Net profit margin
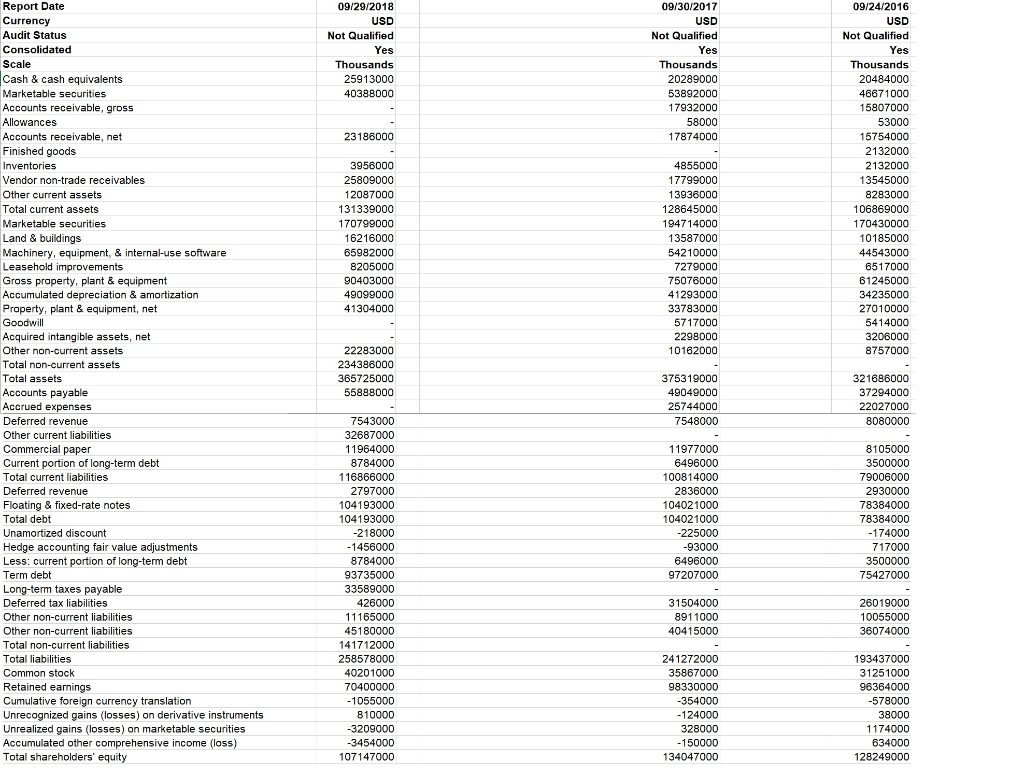
THEN...Describe how and why each of the ratios has changed over the three-year period. For example, did the current ratio increase or decrease? Why? Describe how three of the ratios you calculated for your company (Apple) compare to the general industry.
09/29/2018 USD Not Qualified Yes Thousands 25913000 40388000 09/30/2017 USD Not Qualified Yes Thousands 20289000 53892000 17932000 58000 17874000 23186000 3956000 25809000 12087000 131339000 170799000 162 16000 65982000 8205000 90403000 49099000 41304000 4855000 17799000 13936000 128645000 194714000 13587000 54210000 7279000 75076000 41293000 33783000 5717000 2298000 10162000 09/24/2016 USD Not Qualified Yes Thousands 20484000 46671000 15807000 53000 15754000 2132000 2132000 13545000 8283000 106869000 170430000 10185000 44543000 6517000 81245000 34235000 27010000 5414000 3206000 8757000 Report Date Currency Audit Status Consolidated Scale Cash & cash equivalents Marketable securities Accounts receivable, gross Allowances Accounts receivable, net Finished goods Inventories Vendor non-trade receivables Other current assets Total current assets Marketable securities Land & buildings Machinery, equipment, & internal-use software Leasehold improvements Gross property, plant & equipment Accumulated depreciation & amortization Property, plant & equipment, net Goodwill Acquired intangible assets, net Other non-current assets Total non-current assets Total assets Accounts payable Accrued expenses Deferred revenue Other current liabilities Commercial paper Current portion of long-term debt Total current liabilities Deferred revenue Floating & fixed-rate notes Total debt Unamortized discount Hedge accounting fair value adjustments Less: current portion of long-term debt Term debt Long-term taxes payable Deferred tax liabilities Other non-current liabilities Other non-current liabilities Total non-current liabilities Total liabilities Common stock Retained earnings Cumulative foreign currency translation Unrecognized gains (losses) on derivative instruments Unrealized gains (losses) on marketable securities Accumulated other comprehensive income (loss) Total shareholders' equity 22283000 234386000 365725000 55888000 375319000 49049000 25744000 7548000 321686000 37294000 22027000 8080000 11977000 6496000 100814000 2836000 104021000 104021000 -225000 -93000 6496000 97207000 8105000 3500000 79006000 2930000 78384000 78384000 -174000 717000 3500000 75427000 7543000 32687000 11964000 8784000 116866000 2797000 104193000 104193000 -218000 -1456000 8784000 93735000 33589000 426000 11165000 45180000 141712000 258578000 40201000 70400000 - 1055000 810000 -3209000 -3454000 107147000 31504000 8911000 40415000 26019000 10055000 36074000 241272000 35867000 98330000 -354000 -124000 328000 - 150000 134047000 193437000 31251000 96364000 -578000 38000 1174000 634000 128249000Step by Step Solution
There are 3 Steps involved in it
Step: 1
Get Instant Access to Expert-Tailored Solutions
See step-by-step solutions with expert insights and AI powered tools for academic success
Step: 2
Step: 3
Ace Your Homework with AI
Get the answers you need in no time with our AI-driven, step-by-step assistance
Get Started