-
Use Holts method to create models for each expenditure category. Use Solver to estimate the values of and that minimize the MSE. What are the optimal values of and and the MSE for each model? What is the forecast for next year for each expenditure category?
-
Estimate linear regression models for each expenditure category. What is the estimated regression equation and MSE for each model? What is the forecast for next year for each expenditure category?
-
Fyscos Vice President of Marketing has a new idea for forecasting market demand. For each expenditure category, she wants you to estimate the growth rate represented by g in the following equation: . That is, the estimated value for time period t + 1 is equal to the actual value in the previous time period (t) multiplied by one plus the growth rate g. Use Solver to identify the optimal (minimum MSE) growth rate for each expenditure category. What is the growth rate for each category? What is the forecast for next year for each expenditure category?
-
Which of the three forecasting techniques considered here would you recommend Fysco use for each expenditure category?
I'd like to add, this question has been solved on Chegg before. However, I'd like you to be more specific than this example, showing me what the actual equation is that I plug into the cells. Like what exactly is the decision variables? For c3-c24, what was plugged in? (PLEASE THIS IS THE MOST IMPORTANT PART BECAUSE ALTHOUGH THERE ARE ANSWERS I DONT UNDERSTAND THE STEPS PRIOR ON HOW THEY GOT TO THAT CONCLUSION) if it makes it easier you can attach the excel file document to your response if possible.
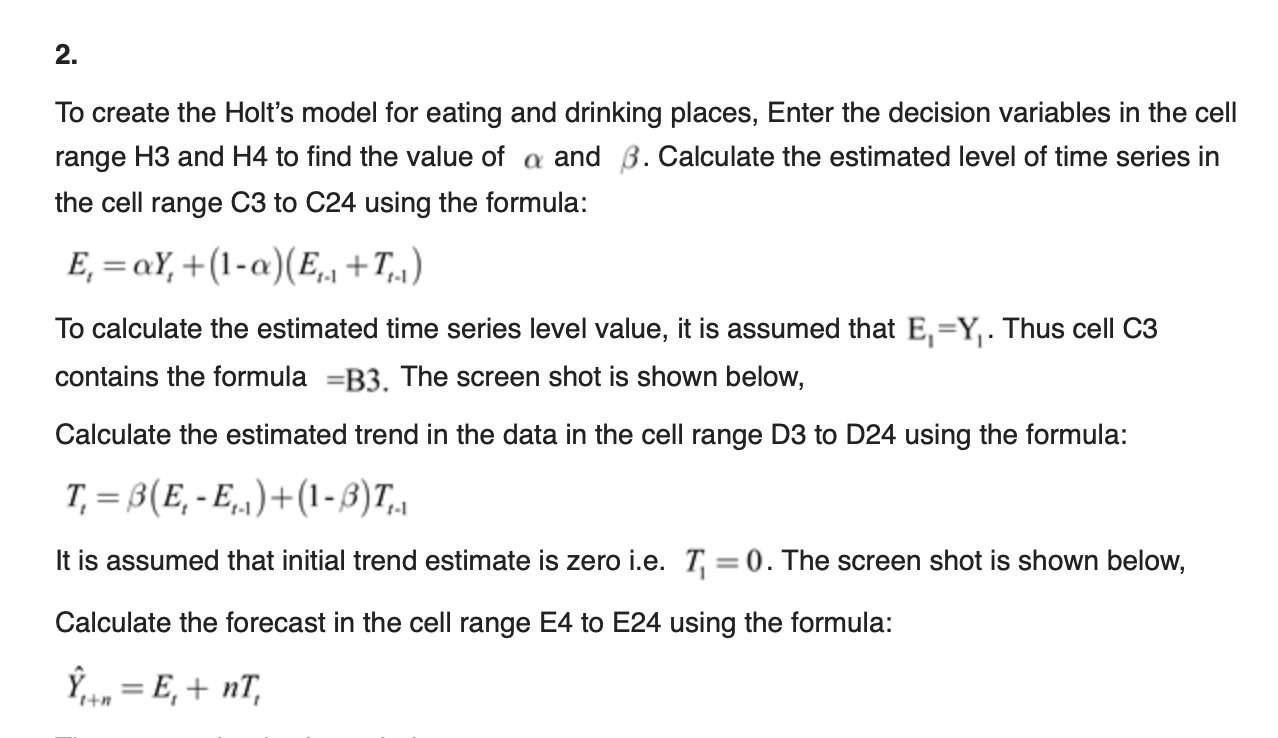
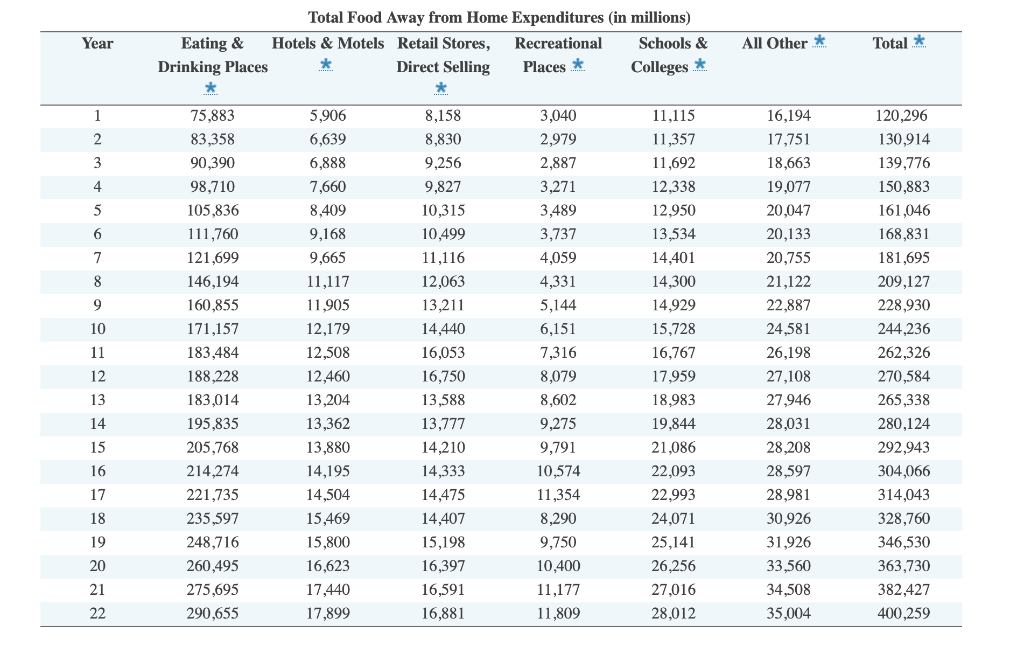
Year All Other * Total * Total Food Away from Home Expenditures (in millions) Eating & Hotels & Motels Retail Stores, Recreational Schools & Drinking Places * Direct Selling Places * * Colleges * 1 75,883 5,906 8,158 3,040 11,115 120,296 16,194 17,751 2 83,358 6,639 8,830 11,357 130,914 2,979 2,887 3 90,390 6,888 9,256 11,692 18,663 139,776 4 98,710 9,827 3,271 19,077 150,883 7,660 8,409 5 105,836 10,315 3,489 12,338 12,950 13,534 20,047 20,133 161,046 168,831 6 111,760 9,168 10,499 3,737 7 121,699 9,665 11,116 4,059 14,401 20,755 181,695 8 146,194 11,117 12,063 4,331 14,300 209,127 21,122 22,887 9 160,855 11,905 13,211 5,144 14,929 228,930 10 171,157 12,179 14,440 6,151 15,728 24,581 244,236 11 183,484 12,508 16,053 7,316 16,767 26,198 262,326 12 188,228 12,460 8,079 17,959 27,108 270,584 16,750 13,588 13 183,014 13,204 8,602 18,983 27,946 265,338 14 195,835 13,362 13,777 9,275 28,031 19,844 21,086 15 205,768 13,880 14,210 28,208 9,791 10,574 280,124 292,943 304,066 16 214,274 14,195 14,333 22,093 28,597 17 221,735 14,504 14,475 11,354 22,993 28,981 314,043 18 14,407 24,071 30,926 328,760 235,597 248,716 15,469 15,800 16,623 8,290 9,750 19 25,141 31,926 346,530 15,198 16,397 20 260,495 10,400 26.256 33,560 363,730 21 275,695 17,440 16,591 11,177 34,508 382,427 27,016 28,012 22 290,655 17,899 16,881 11,809 35,004 400,259 2. To create the Holt's model for eating and drinking places, Enter the decision variables in the cell range H3 and H4 to find the value of a and B. Calculate the estimated level of time series in the cell range C3 to C24 using the formula: E, = OY, +(1-a) (E. +T.) To calculate the estimated time series level value, it is assumed that E,=Y,. Thus cell C3 contains the formula =B3. The screen shot is shown below, Calculate the estimated trend in the data in the cell range D3 to D24 using the formula: T, = B(E,-E,-1)+(1-B)T... It is assumed that initial trend estimate is zero i.e. T, = 0. The screen shot is shown below, Calculate the forecast in the cell range E4 to E24 using the formula: -. = E,+ nT, Year All Other * Total * Total Food Away from Home Expenditures (in millions) Eating & Hotels & Motels Retail Stores, Recreational Schools & Drinking Places * Direct Selling Places * * Colleges * 1 75,883 5,906 8,158 3,040 11,115 120,296 16,194 17,751 2 83,358 6,639 8,830 11,357 130,914 2,979 2,887 3 90,390 6,888 9,256 11,692 18,663 139,776 4 98,710 9,827 3,271 19,077 150,883 7,660 8,409 5 105,836 10,315 3,489 12,338 12,950 13,534 20,047 20,133 161,046 168,831 6 111,760 9,168 10,499 3,737 7 121,699 9,665 11,116 4,059 14,401 20,755 181,695 8 146,194 11,117 12,063 4,331 14,300 209,127 21,122 22,887 9 160,855 11,905 13,211 5,144 14,929 228,930 10 171,157 12,179 14,440 6,151 15,728 24,581 244,236 11 183,484 12,508 16,053 7,316 16,767 26,198 262,326 12 188,228 12,460 8,079 17,959 27,108 270,584 16,750 13,588 13 183,014 13,204 8,602 18,983 27,946 265,338 14 195,835 13,362 13,777 9,275 28,031 19,844 21,086 15 205,768 13,880 14,210 28,208 9,791 10,574 280,124 292,943 304,066 16 214,274 14,195 14,333 22,093 28,597 17 221,735 14,504 14,475 11,354 22,993 28,981 314,043 18 14,407 24,071 30,926 328,760 235,597 248,716 15,469 15,800 16,623 8,290 9,750 19 25,141 31,926 346,530 15,198 16,397 20 260,495 10,400 26.256 33,560 363,730 21 275,695 17,440 16,591 11,177 34,508 382,427 27,016 28,012 22 290,655 17,899 16,881 11,809 35,004 400,259 2. To create the Holt's model for eating and drinking places, Enter the decision variables in the cell range H3 and H4 to find the value of a and B. Calculate the estimated level of time series in the cell range C3 to C24 using the formula: E, = OY, +(1-a) (E. +T.) To calculate the estimated time series level value, it is assumed that E,=Y,. Thus cell C3 contains the formula =B3. The screen shot is shown below, Calculate the estimated trend in the data in the cell range D3 to D24 using the formula: T, = B(E,-E,-1)+(1-B)T... It is assumed that initial trend estimate is zero i.e. T, = 0. The screen shot is shown below, Calculate the forecast in the cell range E4 to E24 using the formula: -. = E,+ nT