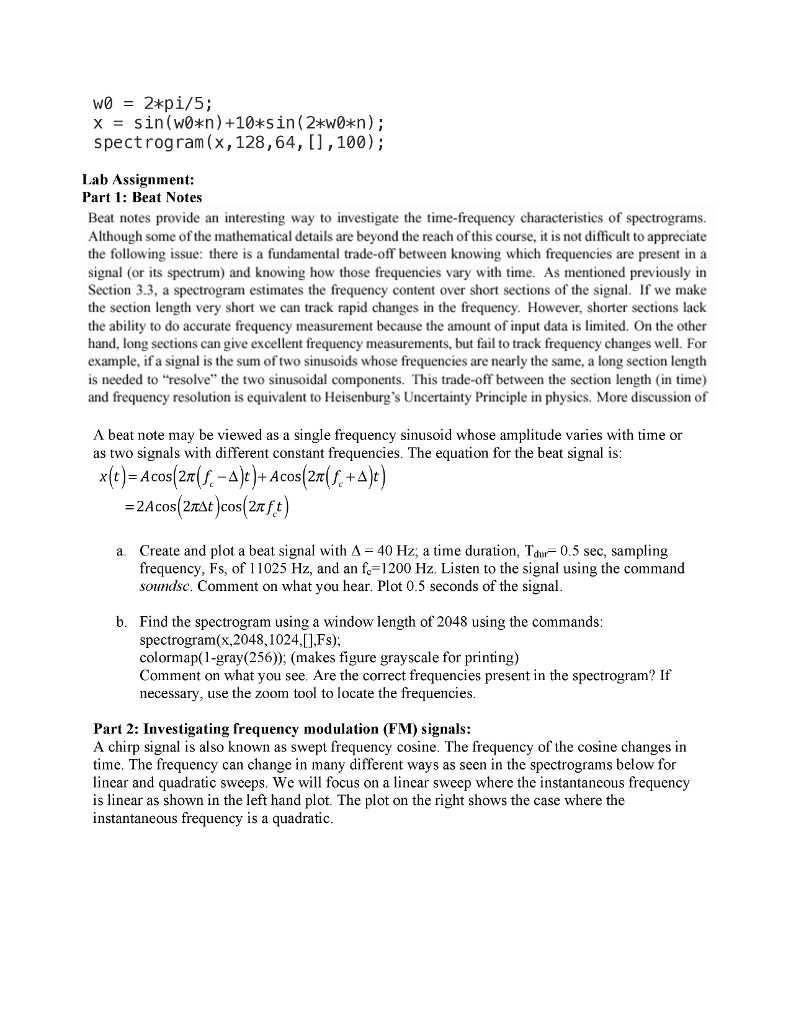
 USE MATHLAB FOR part a and b. The value of A is 1. You need to solve only part 1 answering a and b. The equation used here is for beat note. this is a fully detailed question and I can not answer anything more.
w0 = 2*pi/5: x = sin(w0*n) + 10*sin(2*w0*n): spectrogram(x, 128, 64, [], 100): Beat notes provide an interesting way to investigate the time-frequency characteristics of spectrograms. Although some of the mathematical details are beyond the reach of this course, it is not difficult to appreciate the following issue: there is a fundamental trade-off between knowing which frequencies are present in a signal (or its spectrum) and knowing how those frequencies vary with time. As mentioned previously in Section 3.3, a spectrogram estimates the frequency content over short sections of the signal. If we make the section length very short we can track rapid changes in the frequency. However, shorter sections lack the ability to do accurate frequency measurement because the amount of input data is limited. On the other hand, long sections can give excellent frequency measurements, but fail to track frequency changes well. For example, if a signal is the sum of two sinusoids whose frequencies are nearly the same, a long section length is needed to "resolve" the two sinusoidal components. This trade-off between the section length (in time) and frequency resolution is equivalent to Heisenburg's Uncertainty Principle in physics. More discussion of A beat note may be viewed as a single frequency sinusoid whose amplitude varies with time or as two signals with different constant frequencies. The equation for the beat signal is: x(t) = A cos (2 pi (f_c - Delta)t) + A cos (2 pi (f_c + Delta t) = 2A cos (2 pi Delta t) cos (2 pi f_c t) a. Create and plot a beat signal with Delta = 40 Hz: a time duration, T_dur = 0.5 sec, sampling frequency, Fs, of 11025 Hz, and an f_c = 1200 Hz. Listen to the signal using the command soundsc. Comment on what you hear. Plot 0.5 seconds of the signal. b. Find the spectrogram using a window length of 2048 using the commands: spectrogram(x, 2048, 1024,[], Fs): colormap(1-gray(256)): (makes figure grayscale for printing) Comment on what you see. Are the correct frequencies present in the spectrogram? If necessary, use the zoom tool to locate the frequencies. A chirp signal is also known as swept frequency cosine. The frequency of the cosine changes in time. The frequency can change in many different ways as seen in the spectrograms below for linear and quadratic sweeps. We will focus on a linear sweep where the instantaneous frequency is linear as shown in the left hand plot. The plot on the right shows the case where the instantaneous frequency is a quadratic
 USE MATHLAB FOR part a and b. The value of A is 1. You need to solve only part 1 answering a and b. The equation used here is for beat note. this is a fully detailed question and I can not answer anything more.


