Answered step by step
Verified Expert Solution
Link Copied!

Question

1 Approved Answer

USE MATLAB 1 Find a table of data in an engineering textbook. Enter the table columns into Matlab as vectors and plot them. Label the

USE MATLAB image text in transcribed
1 Find a table of data in an engineering textbook. Enter the table columns into Matlab as vectors and plot them. Label the axes and add a title to your plot to indicate what the data are, their units, and where they came from. Your answer should use the built-in functions plot, xlabel, ylabel, title, There should be a legend if you have more than one data series, but position it so not to hide any of the curves you're plotting. The file you upload to answer this question should be in PDF and include the Matlab commands (script) you used to generate the plot as well as the plot itself

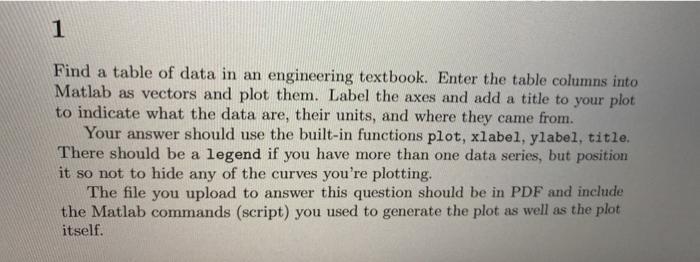
Step by Step Solution

There are 3 Steps involved in it

Step: 1

blur-text-image

Get Instant Access to Expert-Tailored Solutions

See step-by-step solutions with expert insights and AI powered tools for academic success

Step: 2

blur-text-image

Step: 3

blur-text-image

Ace Your Homework with AI

Get the answers you need in no time with our AI-driven, step-by-step assistance

Get Started

Recommended Textbook for

The Accidental Data Scientist

Authors: Amy Affelt

1st Edition

1573877077, 9781573877077

More Books

Students also viewed these Databases questions

Question

What are the Five Phases of SDLC? Explain each briefly.

Answered: 1 week ago

Question

How can Change Control Procedures manage Project Creep?

Answered: 1 week ago