Answered step by step
Verified Expert Solution
Question
1 Approved Answer
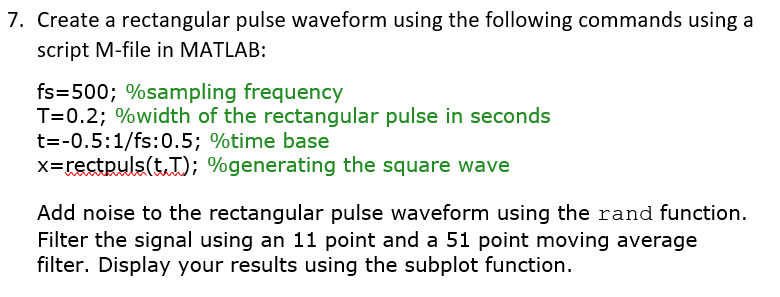
USE MATLAB 7. Create a rectangular pulse waveform using the following commands using a script M-file in MATLAB: fs-500; %sampling frequency T-02; %width of the

USE MATLAB
7. Create a rectangular pulse waveform using the following commands using a script M-file in MATLAB: fs-500; %sampling frequency T-02; %width of the rectangular pulse in seconds t--0.5: 1/fs:0.5: %time base x-rctpuls(LT); %generating the square wave Add noise to the rectangular pulse waveform using the rand function. Filter the signal using an 11 point and a 51 point moving average filter. Display your results using the subplot functionStep by Step Solution
There are 3 Steps involved in it
Step: 1

Get Instant Access to Expert-Tailored Solutions
See step-by-step solutions with expert insights and AI powered tools for academic success
Step: 2

Step: 3

Ace Your Homework with AI
Get the answers you need in no time with our AI-driven, step-by-step assistance
Get Started


